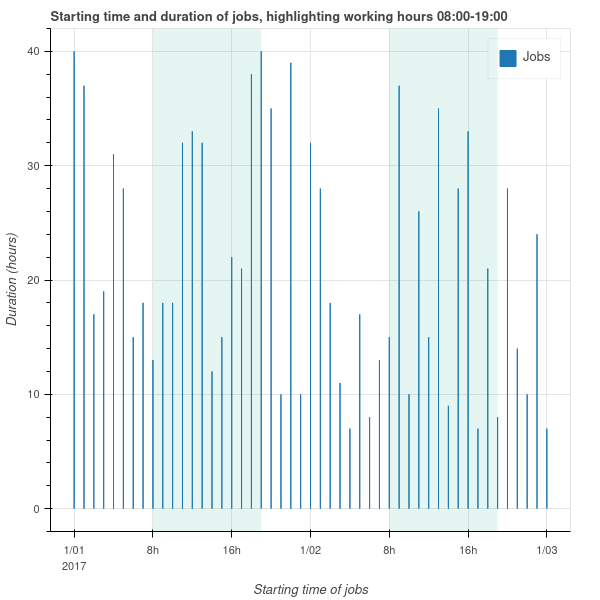
Drawing inspiration from Datetime x-axis Timezone switch - #6 by swamilikes2code, and various hints on dealing with Timestamps, I demonstrated plotting the starting times and duration of some jobs, and highlight, at the same time, working hours. I came up with the following minimal working example (inside a Notebook):
from bokeh.models import ColumnDataSource
from bokeh.models import DatetimeTickFormatter
from bokeh.models import RELATIVE_DATETIME_CONTEXT
from bokeh.models import BoxAnnotation
from bokeh.plotting import figure, show, output_notebook
import pandas
output_notebook()

# start and end timestamps, and how many days
start_datetime=pandas.Timestamp('2017-01-01 00:00:00')
end_datetime=pandas.Timestamp('2017-01-03 00:00:00')
that_many_days = (end_datetime - start_datetime).days

# create a range
timestamps = pandas.date_range(start=start_datetime, end=end_datetime, freq='H')

# and chunk in daily sets
timestamp_sets = [pandas.date_range(start=datetime, periods=24, freq='H') for datetime in pandas.date_range(start=start_datetime, periods=that_many_days, freq='D')]

# create random duration for jobs as many as
number_of_jobs=len(timestamp_sets)*24+1
import random
duration_of_jobs = [random.randint(7,40) for i in range(number_of_jobs)]

# plot!
p = figure(
    title='Starting time and duration of jobs, highlighting working hours 08:00-19:00',
    x_axis_type='datetime',
)

p.vbar(
    x=timestamps,
    top=duration_of_jobs,
    legend_label="Jobs",
)

# highlight working hours
working_hours_bound_sets = []
for timestamps_set in timestamp_sets:
    working_hours = timestamps_set[(timestamps_set.hour >= 8) & (timestamps_set.hour <= 19)]
    working_hours_start = working_hours[0].timestamp() * 1000
    working_hours_end = (working_hours[-1].timestamp()) * 1000
    working_hours_bounds = working_hours_start, working_hours_end
    working_hours_bound_sets.append(working_hours_bounds)
    working_hours = BoxAnnotation(
        left=working_hours_start,
        right=working_hours_end,
        line_color='black',
        line_width=0,
        # line_dash='dashed',
        fill_alpha=0.1,
        # fill_color='silver',
        fill_color='#009E73',
    )
    p.add_layout(working_hours)

p.xaxis.axis_label = "Starting time of jobs"
p.yaxis.axis_label = "Duration (hours)"
p.xaxis.formatter.context = RELATIVE_DATETIME_CONTEXT()

show(p)