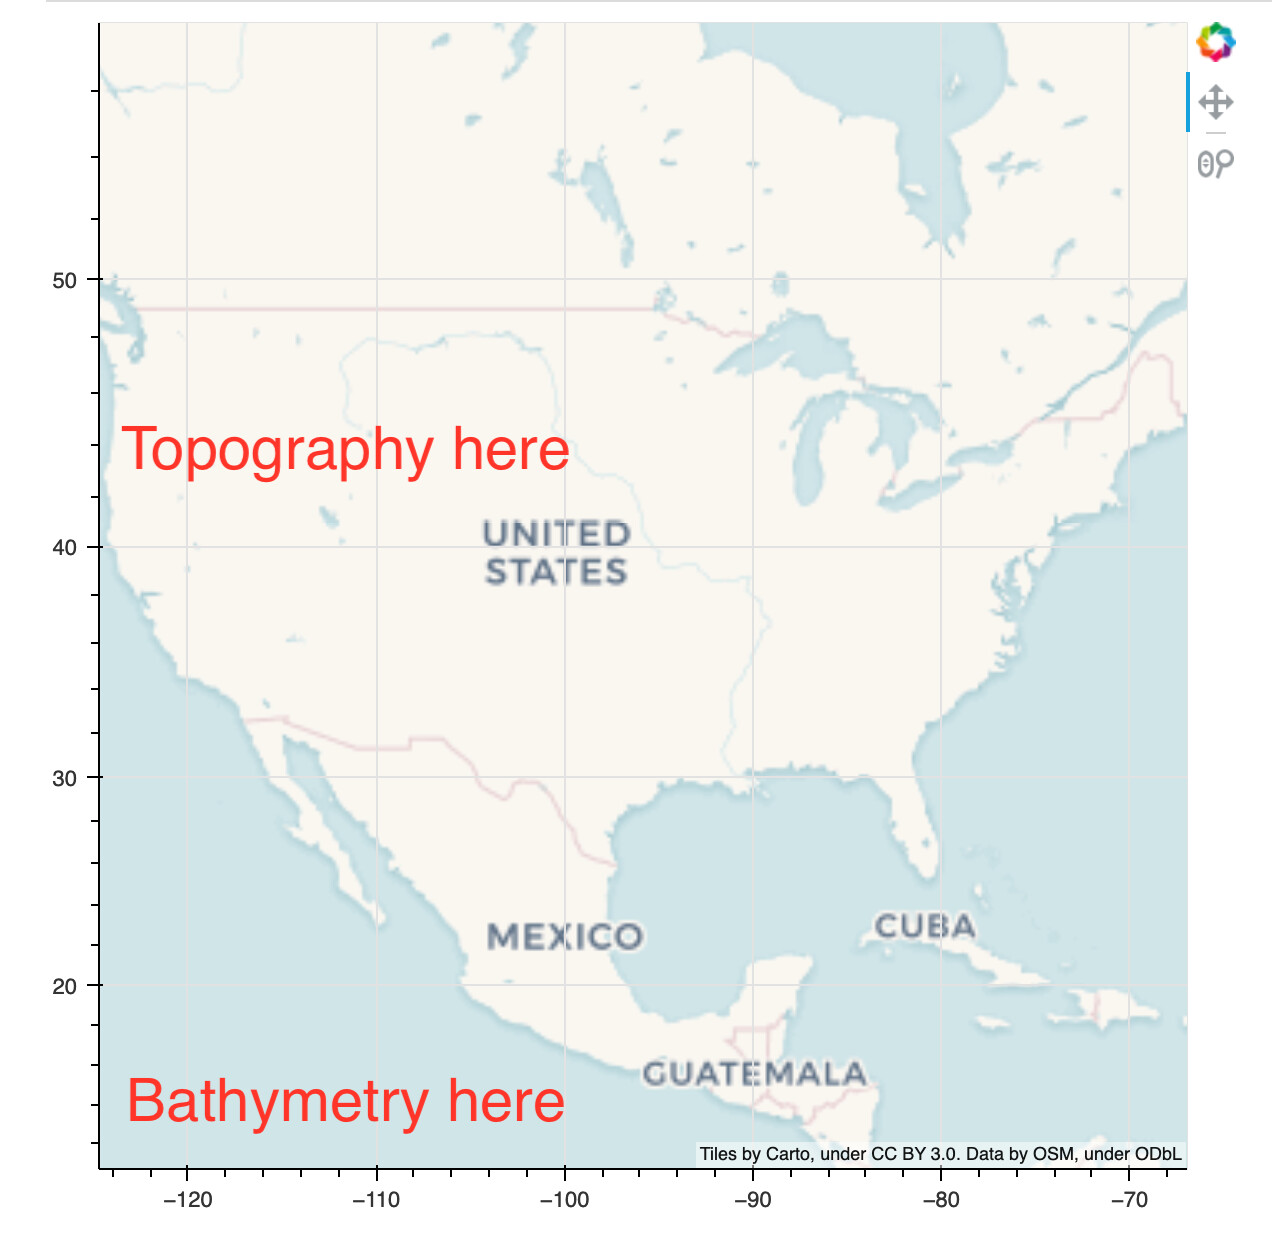
I’m new to Bokeh and working through the fantastic Jupyter notebook examples. Example 09 - Geographic Plots is working fantastically well for me and I’d like to adapt it for a scientific application that I’m working on. Specifically, I’m wondering if and how it might be possible to use Bokeh in this way to show topography and bathymetry (rather than political boundaries) using some of this beautiful automatic tiling approach? Advice much appreciated!
@Brendan_Meade it’s a but unclear, are you asking about configuring a Bokeh tile provider to point at some existing tile server that serves up topograpy tiles? Or are you asking about taking raw data and processing it into tiles and serving those tiles yourself?
Either way, I should probably mention that the next release of Bokeh will support geopandas/xyzservices which is a new project that aims to consolidate tile service handling across all the pydata ecosystem. They may already offer topographic tile sources of some kind (or might be amenable to adding them).
1 Like
My apologies for the unclear question. I’m hoping for: “configuring a Bokeh tile provider to point at some existing tile server that serves up topography tiles”.
The xyzservices integration looks awesome! Perhaps I should wait for that?
Assuming the tile provider has a URL schema amenable to standard XYZ templating, then it’s usually only a matter of configuring your own WMTSTileSource with the URL, You can see how the built-in tile providers are configured here:
https://github.com/bokeh/bokeh/blob/branch-2.4/bokeh/tile_providers.py
The xyzservices integration looks awesome! Perhaps I should wait for that?
Perhaps! The next release should be next week but you’ll have to check and see if they already have the metadata for the topographic tile sources you are interested in.
1 Like
This topic was automatically closed 90 days after the last reply. New replies are no longer allowed.