Hi All,
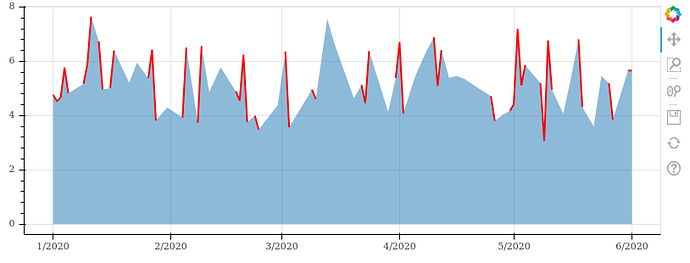
I’m trying to figure out a tidier way to plot vertical filled areas with discontinuous time series data.
With a line plot, gaps are not connected if we leave nan values in the time series. The varea glyph maybe isn’t intended to behave in the same way. I want the blue areas to only cover the same periods as the red line, i.e. I want to have gaps in the blue where there are gaps in the data. I have achieved this visually with a function (code not shown, but derived from here) that finds all gaps in the time series, then adds a new series (and legend item) for each continuous portion, and I’m wondering if there’s a more straightforward way to do this with a single series using an existing Bokeh glyph. Thanks for any guidance!
Code for basic example is below:
import numpy as np
import pandas as pd

from bokeh.plotting import figure, show, output_notebook
from bokeh.models import LinearAxis, Range1d, BoxAnnotation, ColorMapper, Div

output_notebook()

# create random gaps in the record
df = df.iloc[np.random.choice(list(range(len(df))), size=int(len(df)/2), replace=False)]

# resample timeseries to leave nan values
# in data gaps -- for line plots this has
# desired effect of not plotting a line across
# discontinuities
df = df.resample('1D').asfreq()

# maybe the y1 series has to have nan values
# in the same place?
df['y1'] = [0 if ~np.isnan(e) else np.nan for e in df['values']]

def date_or_nan(row):
    if np.isnan(row['values']):
        return np.nan
    else:
        return row.name

# maybe the index should also have discontinuous values?
df['dates'] = df.apply(lambda row: date_or_nan(row), axis=1)

p = figure(width=800, height=300, x_axis_type='datetime')
p.varea(x=df.index, y1=df['y1'], y2=df['values'], alpha=0.5)
p.line(df.index, df['values'], color='red', line_width=2)
# p.varea(x=df.index, y1=df['dates'], y2=df['values'])
show(p)