I thought I’d post the code on how to plot voronoi diagrams using bokeh plots, since it has many use cases.
from scipy.spatial import Voronoi

    def get_voronoi(coord_x, coord_y):
        points = list(zip(coord_x, coord_y))
        #Get Voronoi points
        vor = Voronoi(points)

        x_patch, y_patch = [], []
        x1_patch, y1_patch = [], []
# The Voronoi has 2 parts. The actual patches and the unbounded lines (that run  #indefinitely)
        for region in vor.regions:
            if not -1 in region:
                x1_patch, y1_patch = [], []
                for i in region:
                    x1_patch.append(vor.vertices[i][0])
                    y1_patch.append(vor.vertices[i][1])

            x_patch.append(np.array(x1_patch))
            y_patch.append(np.array(y1_patch))

#This code that gets the multi lines that run indefinitely
        center = vor.points.mean(axis=0)
        ptp_bound = vor.points.ptp(axis=0)

        line_segments = []
        for pointidx, simplex in zip(vor.ridge_points, vor.ridge_vertices):
            simplex = np.asarray(simplex)
            if np.any(simplex < 0):
                i = simplex[simplex >= 0][0]  # finite end Voronoi vertex

                t = vor.points[pointidx[1]] - vor.points[pointidx[0]]  # tangent
                t /= np.linalg.norm(t)
                n = np.array([-t[1], t[0]])  # normal

                midpoint = vor.points[pointidx].mean(axis=0)
                direction = np.sign(np.dot(midpoint - center, n)) * n
                far_point = vor.vertices[i] + direction * ptp_bound.max()

                line_segments.append([(vor.vertices[i, 0], vor.vertices[i, 1]),
                                      (far_point[0], far_point[1])])

        x_vor_ls, y_vor_ls = [], []
        for region in line_segments:

            x1, y1 = [], []
            for i in region:
                x1.append(i[0])
                y1.append(i[1])

            x_vor_ls.append(np.array(x1))
            y_vor_ls.append(np.array(y1))

#Removing patches that were added multiple times.
        x_patch = list(OrderedDict((tuple(x), x) for x in x_patch).values())
        y_patch = list(OrderedDict((tuple(x), x) for x in y_patch).values())
        x_vor_ls = list(OrderedDict((tuple(x), x) for x in x_vor_ls).values())
        y_vor_ls = list(OrderedDict((tuple(x), x) for x in y_vor_ls).values())

        return x_patch, y_patch, x_vor_ls, y_vor_ls

x_patch, y_patch, x_vor_ls, y_vor_ls = get_voronoi(coord_x, coord_y)

source_vor = ColumnDataSource(dict(xs=x_patch, ys=y_patch))
source_vor_ls = ColumnDataSource(dict(xs=x_vor_ls, ys=y_vor_ls))

#plot patches for the Voronoi
glyph_vor = plot.patches('xs', 'ys', source=source_vor, alpha=0.3, line_width=1, fill_color='dodgerblue', line_color='black')

#plot the boundary lines
glyph_ls = plot.multi_line('xs', 'ys', source=source_vor_ls, alpha=1, line_width=1, line_color='black')
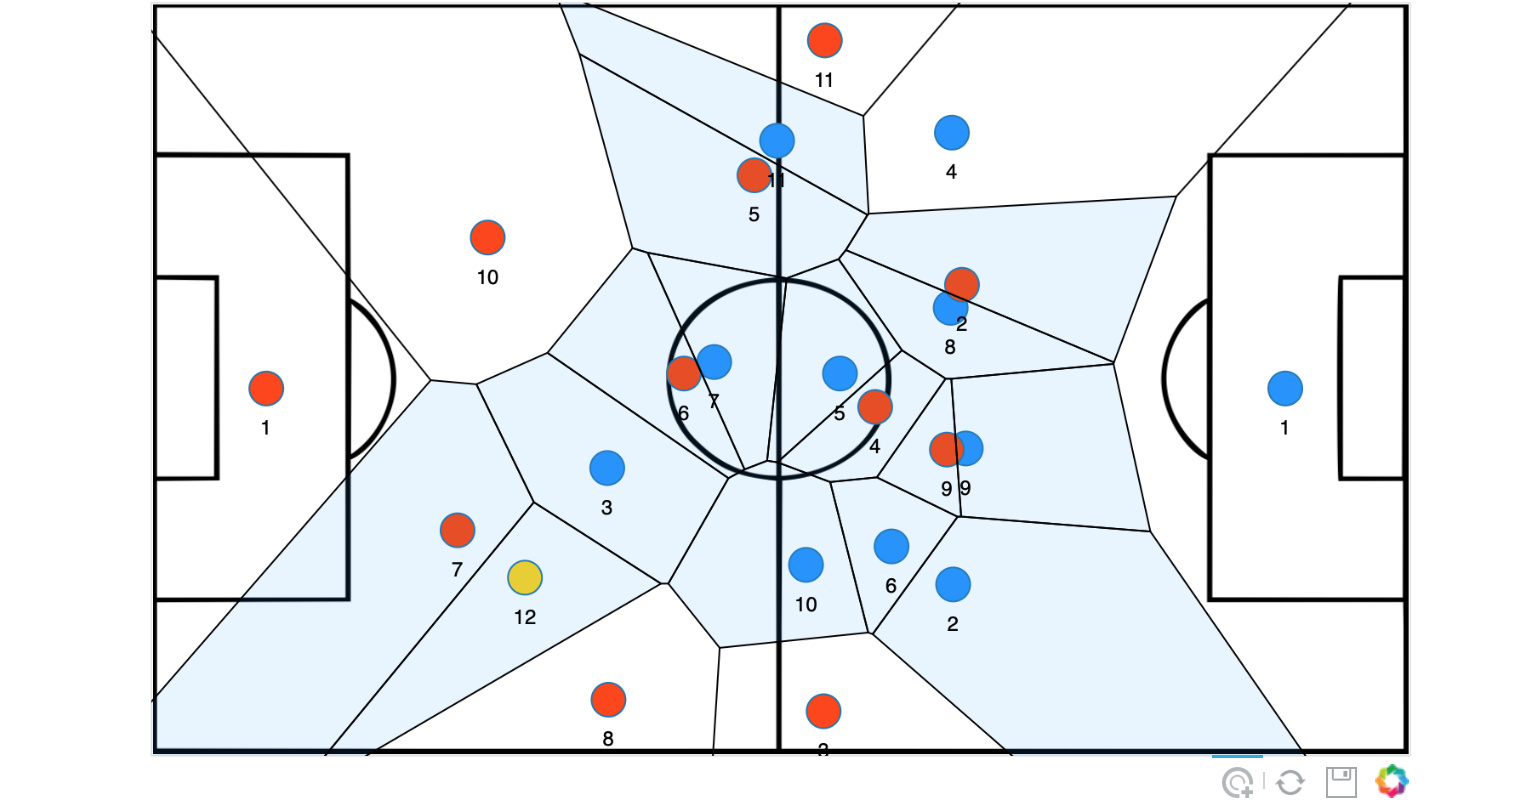
(blue color are the patches and the lines that surround white areas are the multi lines.)
Hope it helps 