Possibility to dodge using CDS columns?

I am creating a simple Revenue, Expenses, Net Profit bar graph.

Item Rev Exp Net
A    10   6   4
B    11  12  -1

Rev and Exp I want to put side by side:

# Revenue vbar
p.vbar(x=dodge("Item", -0.15, range=p.x_range), bottom=0, top="Rev", width=0.3, source=source)

# Expense vbar
p.vbar(x=dodge("Item", 0.15, range=p.x_range), bottom=0, top="Exp", width=0.3, source=source)

For NetProfit, I want to place it on top of Exp if it’s positive, or on top of Rev if negative (picture a vbar_stack). Ie, I want to dodge it by 0.15 if the value is positive and by -0.15 if the value is negative.

I thought I could make an additional column, but it seems like the value field in dodge doesn’t accept CDS columns.

One workaround I found was making a BooleanFilter for all profits that are negative and all profits that are positive. However, this is extremely clunky and though it might be fine for this particular solution, it quickly gets out of hand for other solutions (imagine instead of two dodges per x value, there are n dodges)

Is there anyway to do this elegantly?

You can use CustomJSTransform to do whatever transforms you want on the x, top and bottom values in vbar to accomplish this. It might look a bit complicated but the three transforms follow the same structure/idea: the transform depends on whether profit is positive or negative.

For the x field → we want to shift the bar left or right 0.15 dependent on profit value
For the top field → we want to set the top to the OPPOSITE top value (e.g. top = rev if profit is negative because the bar will be plotted on top of exp)
For the bottom field → we want to set the bottom to the top value (e.g. bottom = exp if profit is negative because the bar will be plotted on top of exp)

Also note that you don’t need a net field at all in the CDS: it’s calculated in the transforms.

> from bokeh.transform import dodge, transform
> from bokeh.models import ColumnDataSource, CustomJSTransform
> from bokeh.plotting import figure, save
> 
> 
> 
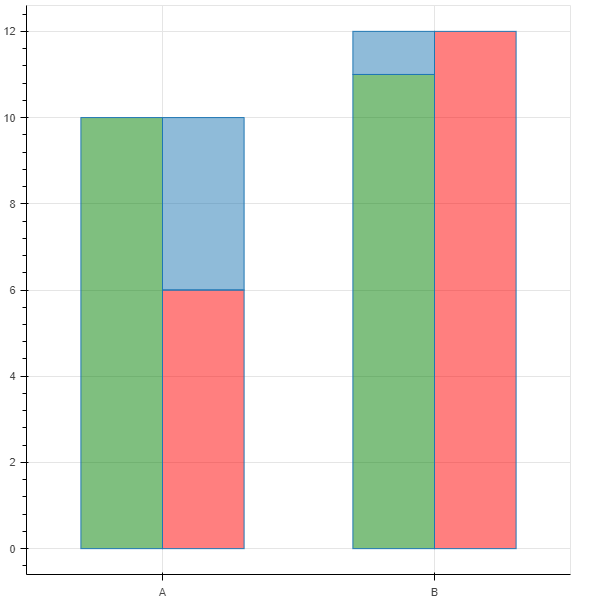
> src = ColumnDataSource(data={'Item':['A','B'],'Rev':[10,11],'Exp':[6,12]})
> p = figure(x_range=src.data['Item'])
> 
> p.vbar(x=dodge('Item',-0.15,range=p.x_range),bottom=0,top='Rev',width=0.3,source=src,fill_color='green',fill_alpha=0.5)
> p.vbar(x=dodge('Item',0.15,range=p.x_range),bottom=0,top='Exp',width=0.3,source=src,fill_color='red',fill_alpha=0.5)
> 
> #set up three transforms
> 
> #x transform: for every record in source, if profit is positive, shift forward 0.15, otherwise shift back 0.15
> #only "trick" is that internally, when you assign a categorical x_range, category A is an x = 0.5, category B = x of 1.5, etc.
> trX = CustomJSTransform(args=dict(src=src)
>                         ,v_func='''
>                         var result = []
>                         for (var i = 0; i < src.data['Item'].length; i++){
>                                 var prof = src.data['Rev'][i]-src.data['Exp'][i]
>                                 if (prof>0){
>                                         result.push(i+0.5+0.15)
>                                         }
>                                 else {
>                                     result.push(i+0.5-0.15)
>                                     }
>                                 }
>                         return result
>                         '''
>                         )
> #top transform: for every record in source, if profit is positive, then set top = Rev, otherwise set top to Exp
> trTop = CustomJSTransform(args=dict(src=src)
>                         ,v_func='''
>                         var result = []
>                         for (var i = 0; i < src.data['Item'].length; i++){
>                                 var prof = src.data['Rev'][i]-src.data['Exp'][i]
>                                 if (prof>0){
>                                         result.push(src.data['Rev'][i])
>                                         }
>                                 else {
>                                     result.push(src.data['Exp'][i])
>                                     }
>                                 }
>                         return result
>                         '''
>                         )
> #bot transform is basically the opposite of top--->
> # for every record in source, if profit is positive, then set bot = Exp, otherwise set bot to Rev
> trBot = CustomJSTransform(args=dict(src=src)
>                         ,v_func='''
>                         var result = []
>                         for (var i = 0; i < src.data['Item'].length; i++){
>                                 var prof = src.data['Rev'][i]-src.data['Exp'][i]
>                                 if (prof>0){
>                                         result.push(src.data['Exp'][i])
>                                         }
>                                 else {
>                                     result.push(src.data['Rev'][i])
>                                     }
>                                 }
>                         return result
>                         '''
>                         )
> 
> p.vbar(x=transform(field_name='Item',transform=trX)
>        ,top=transform(field_name='Item',transform=trTop)
>        ,bottom=transform(field_name='Item',transform=trBot)
>        ,width=0.3,source=src,fill_alpha=0.5)
> 
> save(p,r'E:\Personal\test.html')

3 Likes

Just confirming that the dodge transform does only accept a single scalar value as configuration. No one has ever asked for a vectorized capability before. It would certainly be possible in principle but it would require further configuring the transform with a source parameter (so that it knows what CDS to look in for the column). It already seems a bit clunky in that the range has to be passed in explicitly, so I am not especially excited about the idea of making things even more verbose.

We could potentially resort to “automagic” solutions like having a glyph renderer internally configure itself on any transforms that get used on its coordinates, so that the transform can later “query” the renderer for any information it needs (e.g its data source). But that would add a huge amount of complexity (in principle, transforms can be added, removed dynamically, or even shared so now there is a giant pile of state that has to accounted for all the time, and probable hidden race conditions introduced). So I’m pretty :-1: on that, too.

I completely agree on your points. Thanks for looking into it and your thoughts!

I think my case is highly unique and I don’t foresee many applications of this tiny sliver of the bokeh universe…I’ve been using bokeh for over a year and made countless graphs, but this is the first time I’ve run into vectorizing a transform. A cursory check on posts in this community before I posted also showed no one else running into this problem.

I think I’ll be using @gmerritt123 's solution as it is certainly the most elegant one I’ve seen.

1 Like

This topic was automatically closed 90 days after the last reply. New replies are no longer allowed.