Hi everyone !
I would like to scatter points with different colors and alphas. I read
http://bokeh.pydata.org/en/latest/docs/user_guide/styling.html
And it says:
- Colors
properties are used in many places in Bokeh, to specify the colors to use for lines, fills or text. Color values can be provided in any of the
following ways:*
- any of the 147 named CSS colors, e.g
'green','indigo' - an RGB(A) hex value, e.g.,
'#FF0000','#44444444' - a 3-tuple of integers (r,g,b) between 0 and 255
-
a 4-tuple of (r,g,b,a) where r, g, b are integers between 0 and 255 and a is a floating point value between 0 and 1
and
I am not sure if I found some bugs or whether I just don’t get the documentation above or I am confusing something …Having some initial code :
TOOLS=“resize,crosshair,pan,wheel_zoom,box_zoom,reset,tap,previewsave,box_select,poly_select,lasso_select”
output_file(“color_scatter.html”, title=“color_scatter.py example”)
p = figure(tools=TOOLS)
Now some experiments :
----- ----- ----- ----- 1st problem ----- ----- ----- ----- ----- ----- ----- Can’t specify alpha in hexadecimal format
p.scatter([1,2,3], [1,2,3], radius=[0.05,0.1,0.2], fill_color=“red”, fill_alpha=0.6, line_color=“Black”)
show(p) # all good, red points as expected with alpha 0.6
p.scatter([1,2,3], [1,2,3], radius=[0.05,0.1,0.2], fill_color=“FF00000077”, line_color=“Black”)
show # now I thought I would get transparent red points by specifiing alpha to bde 0x77 but all points are just white.
Therefore I am ble to do this :
p.scatter([1,2,3], [1,2,3], radius=[0.05,0.1,0.2], fill_color=["#44FF4455", “#FF0000”, “#00FF00”], line_color=“Black”)
but not this
p.scatter([1,2,3], [1,2,3], radius=[0.05,0.1,0.2], fill_color=["#44FF4455", “#FF000088”, “#00FF00AA”], line_color=“Black”)
----- ----- ----- ----- 2nd problem ----- ----- ----- ----- ----- ----- ----- Can’t specify alpha in hexadecimal format
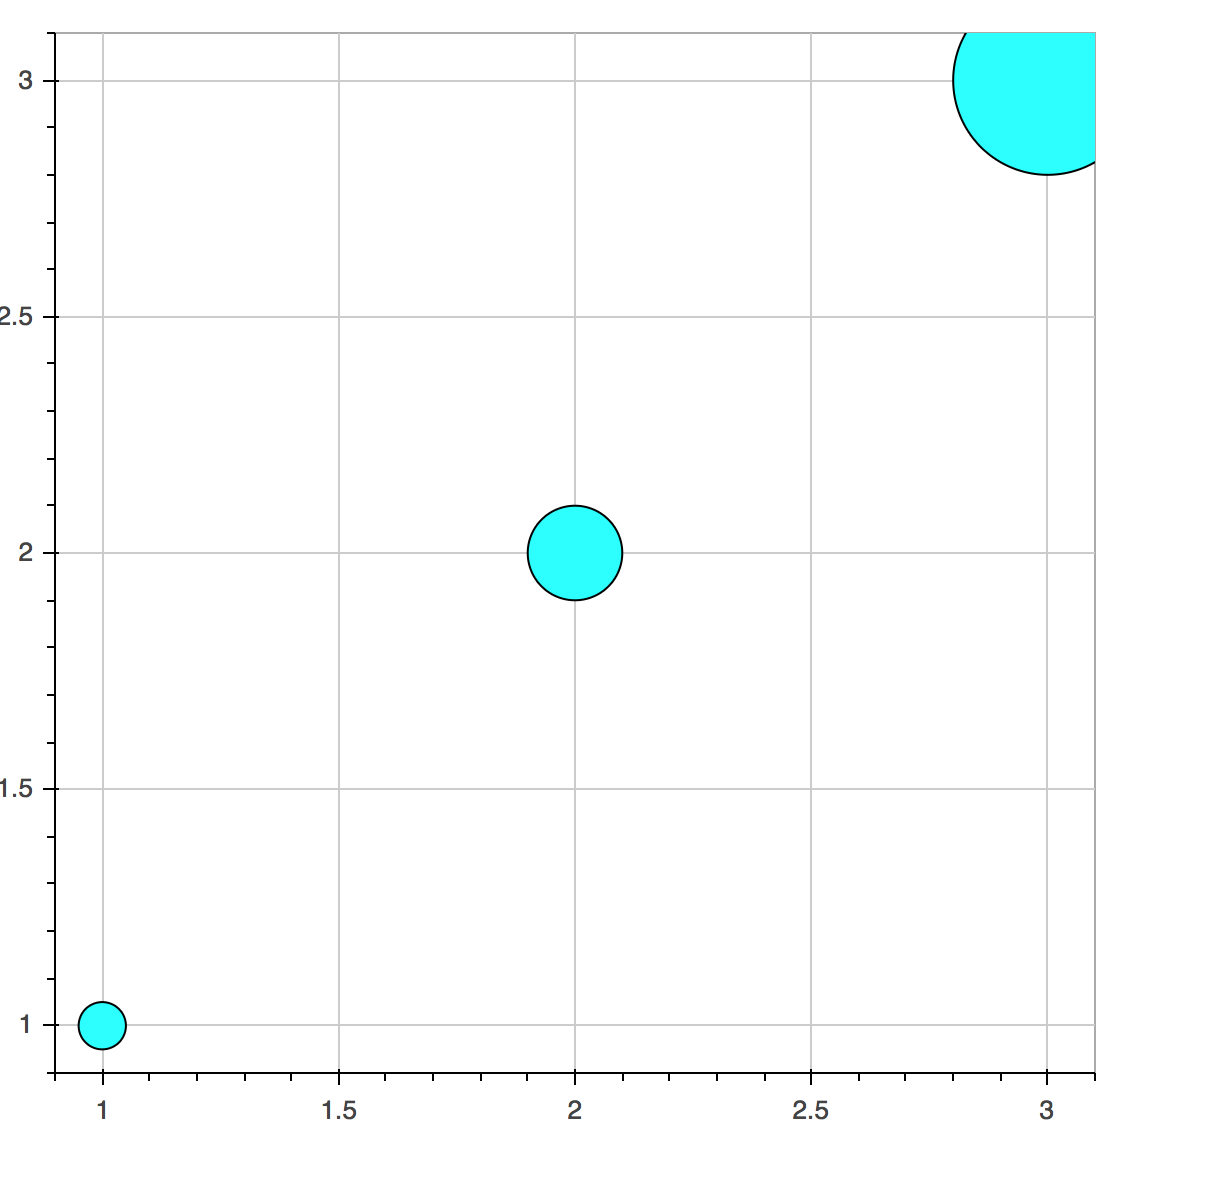
p.scatter([1,2,3], [1,2,3], radius=[0.05,0.1,0.2], fill_color=(0,255,255), line_color=“Black”);
show( p ) # works ok, skyblue scatter points
p.scatter([1,2,3], [1,2,3], radius=[0.05,0.1,0.2], fill_color=(0,255,255,255), line_color=“Black”);
show( p ) # adding the additional alpha this way completely breaks everything and nothing gets displayed at all
** -----
----- ----- ----- 3rd problem ----- ----- ----- ----- ----- ----- -----
Can’t specify array of for colors in list/tupple format**
p.scatter([1,2,3], [1,2,3], radius=[0.05,0.1,0.2], fill_color=[‘blue’,‘green’,‘red’], line_color=“Black”);
show( p ) # everything as expected, 3 points, different colors
p.scatter([1,2,3], [1,2,3], radius=[0.05,0.1,0.2], fill_color=[(0,0,255),(0,255,0),(255,0,0)], line_color=“Black”)
show ( p ) # I get just 3 white points
p.scatter([1,2,3], [1,2,3], radius=[0.05,0.1,0.2], fill_color=[[0,0,255],[0,255,0],[255,0,0]], line_color=“Black”)
show ( p ) # I get just 3 white points
Thank you for insights and comments in forward !!