Problem with ticks for custom log_color_mapper allowing negative values

[Bokeh 2.3.2]
Hi there,

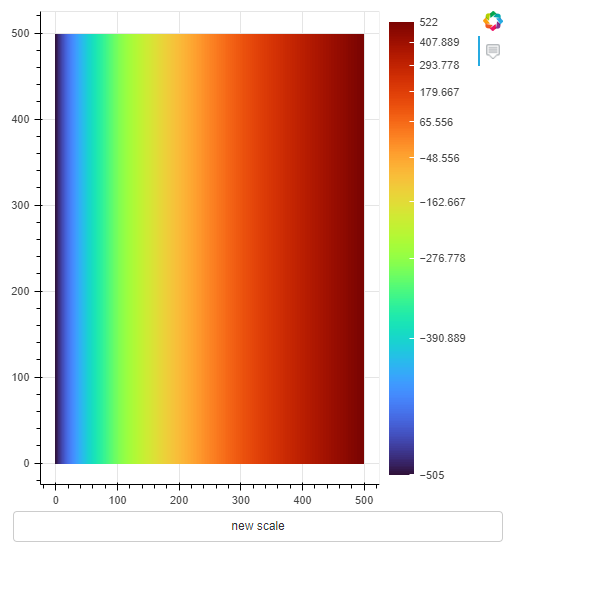
I have created some custom models to allow having a logarithmic color_mapper with negative {low or high}-values by simply doing an offset by abs(min(data))+1 if theres values <= 0 .
The color_mapper itself works great. The data is, even with negative values, mapped correctly.

This is the modified LogColorMapper:

OffsetLogColorMapper

TSCODE = """
import {LogColorMapper} from "models/mappers/log_color_mapper"
import {Arrayable} from "core/types"
import {min, max} from "core/util/arrayable"

export type OffsetLogScanData = {
  min: number
  max: number
  scale: number
  offset: number
}

export class OffsetLogColorMapper extends LogColorMapper {
  protected scan(data: Arrayable<number>, n: number): OffsetLogScanData {
    let low = this.low != null ? this.low : min(data)
    let high = this.high != null ? this.high : max(data)
    let offset = 0
    if (low <= 0){
        // low and high cannot be offset here,
        // as they are passed to the tickers get_ticks
        // if we did offset, we would get ticks from 0 to y+x
        // instead of -x to y
        offset = Math.abs(low) + 1
    }
    const scale = n / (Math.log(high+offset) - Math.log(low+offset))  // subtract the low offset
    return {max: high, min: low, scale, offset}
  }

  protected cmap<T>(d: number, palette: Arrayable<T>, low_color: T, high_color: T, scan_data: OffsetLogScanData): T {
    const max_key = palette.length - 1
    d += scan_data.offset
    let _max = scan_data.max + scan_data.offset
    let _min = scan_data.min + scan_data.offset
    if (d > _max) {
      return high_color
    }
    // This handles the edge case where d == high, since the code below maps
    // values exactly equal to high to palette.length, which is greater than
    // max_key
    if (d == _max){
      return palette[max_key]
    }
    else if (d < _min){
      return low_color
    }

    // Get the key
    const log = Math.log(d) - Math.log(_min)  // subtract the low offset
    let key = Math.floor(log * scan_data.scale)

    // Deal with upper bound
    if (key > max_key) {
      key = max_key
    }
    return palette[key]
  }
}

"""
from bokeh.models import LogColorMapper


class OffsetLogColorMapper(LogColorMapper):
    __implementation__ = TSCODE
    ''' Works exactly the same as its base class, however
        OffsetLogColorMapper also allows mapping datasets
        with negative values. This does not work like mpl's
        symlog but instead we use a standard log and offset
        every value <= 0.
    '''

I also had to subclass LogTickFormatter and LogTicker (Doesn’t really matter for this problem).
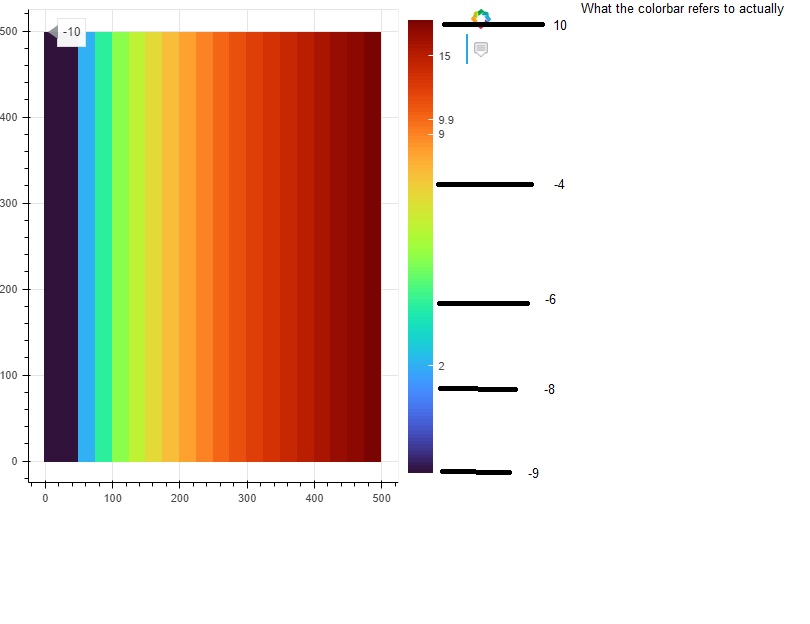
The problem:
The y_axis_type of the ColorBar is log_axis. I think this is why the ticks do not appear at the right location? If I use negative ticks they cause Error: invalid bbox, if I use positive ticks they appear where they should be if you looked at a range of (0,20) instead of(-10,10).

Examplatory Image

Demo Code
from bokeh.models import HoverTool
from bokeh.models import FixedTicker
from bokeh.palettes import turbo
from bokeh.models import ColorBar
from bokeh.plotting import figure
from bokeh.io import show
from bokeh.settings import settings
settings.minified = False
palette = turbo(128)
data_arr = [[i for i in range(-10, 10)] for j in range(-10, 10)]
lg = OffsetLogColorMapper(palette, low=-9, high=9)
c = ColorBar(color_mapper=lg, ticker=FixedTicker(ticks=[-5, 2, 9]))#, 
formatter=OffsetLogTickFormatter(), ticker=OffsetLogTicker())
fig = figure(width=500, height=500, tools=[])
fig.image(image=[data_arr], x=0, y=0, dw=500, dh=500, color_mapper=lg)
fig.add_tools(HoverTool(tooltips="@image"))
fig.add_layout(c, "right")
show(fig)

I’m not really sure what to do at this point. Do I also have to create a custom log_axis? If so, how would I make the colorbar use that.

I hope there’s a way to save this. (Simply offsetting my dataset into positives isn’t really an option)

You would need to, but it’s not currently possible to configure the axis on a Colorbar manually, as it is purely a hidden implementation detail. There is ongoing work around sub-plots and sub-coordinate systems that will eventually make the Colorbar more modular, but I can’t speculate when it will be done.

Unless you are interested in a fair amount of JS implementation work [1]. you might be better off looking at a different tool for this specific use case.


  1. e.g. for a custom Colorbar model that uses your custom ticker, an draws ticks based on that ↩︎

Hey,
thanks for your response, I guess your option would’ve worked, too.

But, after a lot of fun playing around with exp & log, I managed to hack myself a decently working example together. It’s actually very straight forward.

For anyone interested:
Basically I mapped the values of the supplied interval, e.g. [-152, 12] onto a fixed interval [1,10] (See transformation - Shift numbers into a different range - Mathematics Stack Exchange)
(This could’ve also been done without that interval, but this allow me to have a proper exponential scale even for very small supplied intervals without having to wrestle with log bases)

I then “un”-mapped the interval in the TickFormatter (I had to supply the interval explicitly)

offset_log_color_mapper.py
from bokeh.core.properties import Seq, Float
from bokeh.layouts import column
from bokeh.models import LogColorMapper


class OffsetLogColorMapper(LogColorMapper):
    __implementation__ = 'offset_log_color_mapper.ts'
    ''' Works exactly the same as its base class, however
        OffsetLogColorMapper also allows mapping datasets
        with negative values. This does not work like mpl's
        symlog but instead we use a standard natural log on 
        an interval [1, 10] (unless otherwise specified), which
        the input data interval, e.g, [-5, 51] is then mapped to.
    '''

    log_span = Seq(Float, default=[1, 10], help="""
            This is used to determine the steepness of
            the log-scale.
        """)
offset_log_color_mapper.ts
import {LogColorMapper} from "models/mappers/log_color_mapper"
import {Arrayable} from "core/types"
import {min, max} from "core/util/arrayable"
import * as p from "core/properties"

export type OffsetLogScanData = {
  min: number
  max: number
  scale: number
  interval: number[]
}

export namespace OffsetLogColorMapper {
  export type Attrs = p.AttrsOf<Props>

  export type Props = LogColorMapper.Props & {
    log_span: p.Property<number[]>
  }
}

export interface OffsetLogColorMapper extends OffsetLogColorMapper.Attrs {}

export class OffsetLogColorMapper extends LogColorMapper {
  properties: OffsetLogColorMapper.Props
  constructor(attrs?: Partial<OffsetLogColorMapper.Attrs>) {
    super(attrs)
  }

  static init_OffsetLogColorMapper(): void {
    this.define<OffsetLogColorMapper.Props>(({Array, Number}) => ({
      log_span: [Array(Number), [1, 10]],
    }))
  }

  protected scan(data: Arrayable<number>, n: number): OffsetLogScanData {
    let low = this.low != null ? this.low : min(data)
    let high = this.high != null ? this.high : max(data)
    let span = this.log_span !=null ? this.log_span : [1, 10]

    const interval = [low, high]
    const scale = n / (Math.log(span[1]) - Math.log(span[0]))  // n
    return {max: span[1], min: span[0], scale, interval}
  }

  protected cmap<T>(d: number, palette: Arrayable<T>, low_color: T, high_color: T, scan_data: OffsetLogScanData): T {
    const max_key = palette.length - 1
    let _max = scan_data.max
    let _min = scan_data.min
    let interval = scan_data.interval
    d = _min + (_max-_min)/(interval[1]-interval[0])*(d-interval[0])  // https://math.stackexchange.com/a/914843

    if (d > _max) {
      return high_color
    }
    // This handles the edge case where d == high, since the code below maps
    // values exactly equal to high to palette.length, which is greater than
    // max_key
    if (d == _max){
      return palette[max_key]
    }
    else if (d < _min){
      return low_color
    }

    // Get the key
    const log = Math.log(d) - Math.log(_min)  // subtract the low offset
    let key = Math.floor(log * scan_data.scale)

    // Deal with upper bound
    if (key > max_key) {
      key = max_key
    }
    return palette[key]
  }
}
offset_log_tick_formatter.py
from bokeh.models.formatters import LogTickFormatter
from bokeh.core.properties import Float, Seq


class OffsetLogTickFormatter(LogTickFormatter):
    __implementation__ = "offset_log_tick_formatter.ts"

    low = Float(default=0, help="""
        REQUIRED! Should be set to the ColorMapper's low value (equal to min(data) if unspecified)
    """)
    high = Float(default=0, help="""
        REQUIRED! Should be set to the ColorMapper's high value (equal to max(data) if unspecified)
    """)
    log_span = Seq(Float, default=[1, 10], help="""
        This value is used for determining the tick labels. This has only
        to be changed if you change the default log_span of the corresponding
        OffsetLogColorMapper!
    """)

This text will be hidden

offset_log_tick_formatter.ts
import {LogTickFormatter} from "models/formatters/log_tick_formatter"
import {min, max} from "core/util/arrayable"
import {GraphicsBox} from "core/graphics"
import * as p from "core/properties"


export namespace OffsetLogTickFormatter {
  export type Attrs = p.AttrsOf<Props>

  export type Props = LogTickFormatter.Props & {
    min_exponent: p.Property<number>
    low: p.Property<number>
    high: p.Property<number>
    log_span: p.Property<number[]>
  }
}

export interface OffsetLogTickFormatter extends OffsetLogTickFormatter.Attrs {}

export class OffsetLogTickFormatter extends LogTickFormatter {
  properties: OffsetLogTickFormatter.Props
  constructor(attrs?: Partial<OffsetLogTickFormatter.Attrs>) {
    super(attrs)
  }

  static init_OffsetLogTickFormatter(): void {
    this.define<OffsetLogTickFormatter.Props>(({Array, Number}) => ({
      low: [ Number , 0 ],
      high: [ Number , 0 ],
      log_span: [Array(Number), [1, 10]]
    }))
  }

  format_graphics(ticks: number[], opts: {loc: number}): GraphicsBox[] {
    if (ticks.length == 0)
      return []

    const start = min(this.log_span)
    const end = max(this.log_span)

    ticks = ticks.map((value)=> {
        return this.low + (this.high-this.low)/(end-start)*(value-start)
    });

    return this.basic_formatter.format_graphics(ticks, opts)

  }
}
Running it
import numpy as np
from random import randint as ri

from offset_log_tick_formatter import OffsetLogTickFormatter
from offset_log_color_mapper import OffsetLogColorMapper
from bokeh.models import HoverTool
from bokeh.palettes import turbo
from bokeh.models import ColorBar, Button
from bokeh.plotting import figure
from bokeh.io import curdoc
from bokeh.settings import settings
settings.minified = False

palette = turbo(256)
data_arr = [list(np.arange(-505, 523, 1)) for j in range(-10, 10)]

cm = OffsetLogColorMapper(palette)
tf = OffsetLogTickFormatter()
#cm.js_link("low", tf, "low")  # replaced with a server-side cb because I'd like to have the functionality
#cm.js_link("high", tf, "high") # available even before the JS is loaded
c = ColorBar(color_mapper=cm, formatter=tf)
fig = figure(width=500, height=500, tools=[])
fig.image(image=[data_arr], x=0, y=0, dw=500, dh=500, color_mapper=cm)
fig.add_tools(HoverTool(tooltips="@image"))
fig.add_layout(c, "right")
btn = Button(label="new scale")

def on_change(attr, old, new):
    setattr(tf, attr, new)

cm.on_change('low', on_change)
cm.on_change('high', on_change)
cm.update(low=np.min(data_arr), high=np.max(data_arr))
def new_bounds(x):
    cm.low = ri(50, 1000)
    cm.high = cm.low+500

btn.on_click(new_bounds)

curdoc().add_root(column(fig, btn))

1 Like