HI,
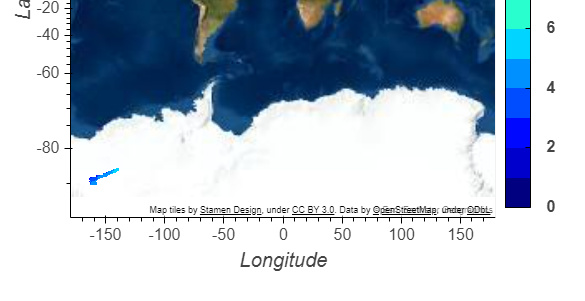
I have a plot, plot is coming fine but the latitude and longitude label is not coming correct, Projection Error its showing , I try to do formatting using xformatter=’%.5f’ ,yformatter=’%.5f’ but still the result is same,
Kindly let me know how to solve this issue as my desire plot area is coming very small, lat long e power labels and zoom also not working.
Two things not coming:-
1- Not correct Latitude & Longitude labels
2- Map is not coming as background.
opts = dict(width=700, height=700,xformatter='%.5f' ,yformatter='%.5f', tools=['hover', 'save', 'wheel_zoom'], active_tools=['wheel_zoom'],
            hooks=[plot_limits, disable_logo], colorbar=True, color_levels=15,
            colorbar_opts=colorbar_opts, cmap=['#000080',
                                               '#0000cd',

                                               '#0008ff',
                                               '#004cff',
                                               '#0090ff',
                                               '#00d4ff',
                                               '#29ffce',
                                               '#60ff97',
                                               '#97ff60',
                                               '#ceff29',
                                               '#ffe600',
                                               '#ffa700',
                                               # '#ff6800',
                                               '#ff2900',
                                               '#cd0000',
                                               '#800000',

                                               ], clim=(0, 15), title="\t\t\t\t\t\t\t\t\t Mean Wave Period (s) ",
            fontsize={'title': 18, 'xlabel': 15, 'ylabel': 15, 'ticks': 12})

finalplot = Column(tiles * rasterize(hmap1).options(**opts) .opts(xformatter='%.5f' ,yformatter='%.5f',hooks=[absolute_position],
                                                                            apply_ranges=False))

Thank you,
I will b glad to know the solution of above two issue.