Hi, I was working through the gapminder data set (I used this *.csv file as is, with no changes). I wish to have sliders for the year, life, population and income columns, to select minimum value for each. Also, I require a selection menu to choose x and y from any of year, life, population and income columns of the dataset.
I took the IMDB Bokeh Gallery and I have modified the main.py source code as below:
from bokeh.plotting import figure
from bokeh.layouts import layout, widgetbox
from bokeh.models import ColumnDataSource
from bokeh.io import curdoc
from bokeh.models.widgets import Slider, Select
import pandas as pd

dfr = pd.read_csv('gapminder.csv',thousands=',')

axis_map = {"Pop":"population", "Life":"life", "Inc":"income", "Year":"Year"}

life = Slider(title='Li',value=0,start=0,end=40)
inc = Slider(title='In',value=0,start=0,end=10000)
pop = Slider(title='Po',value=0,start=1,end=100000)
year = Slider(title='Ye',value=0,start=5,end=100)
x_axis = Select(title="X Axis", options=sorted(axis_map.keys()), value="Inc")
y_axis = Select(title="Y Axis", options=sorted(axis_map.keys()), value="Pop")

s = ColumnDataSource(data=dict(x=[], y=[], lif=[], incm=[], popul=[], yr=[]))

p = figure(title="", toolbar_location='above', title_location='left', tools=[h])
p.circle(x='x', y='y', source=s, legend='region')
p.legend.border_line_color=None; p.legend.location=(0,0); p.right.append(p.legend[0])

def selected():
    data = dfr[(dfr['life']>=life.value) & (dfr['income']>=inc.value) &\
        (dfr['population']>=pop.value) & (dfr['Year']>=year.value)]
    return data

def update():
    data = selected()
    x_name = axis_map[x_axis.value];  y_name = axis_map[y_axis.value]
    p.xaxis.axis_label = x_axis.value;  p.yaxis.axis_label = y_axis.value

    s.data = dict(x=df[x_name], y=df[y_name],
        lif=df["life"], incm=df["income"],
        popul=df["population"], yr=df["Year"])

controls = [life,inc,pop,year]
for c in controls:
    c.on_change('value', lambda attr, old, new: update())

sizing_mode = 'fixed'
inputs = widgetbox(*controls, sizing_mode=sizing_mode)
l = layout([
    [inputs, p],
    ], sizing_mode=sizing_mode)
update()
curdoc().add_root(l)
curdoc().title = y_axis.value
``
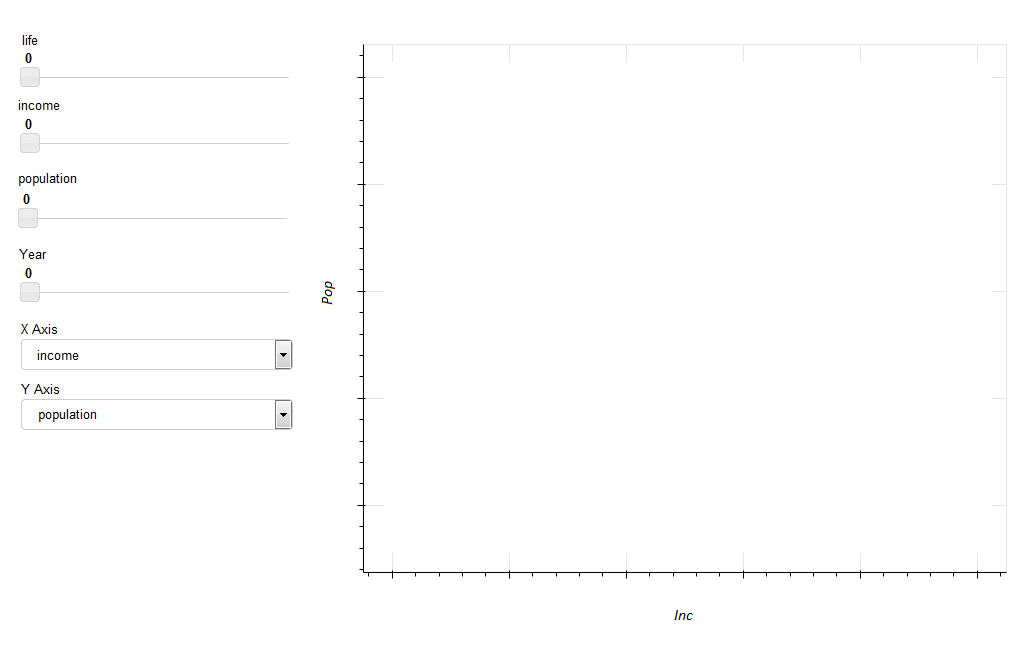
Running this script, gives this output:
Traceback (most recent call last):
  File "/home/userD/test.py", line 55, in <module>
    update()
  File "/home/userD/test.py", line 36, in update
    df = selected()
  File "/home/userD/test.py", line 32, in selected
    df = dfr[(dfr['life']>=l.value) & (dfr['income']>=i.value) &\
        (dfr['population']>=po.value) & (dfr['Year']>=ye.value)]
AttributeError: 'Column' object has no attribute 'value'
``
This seems to suggest there is a problem with the data source. All the columns in the variable source have sliders and so I specified all the columns in update() and selected(). However, I am not sure if I have implemented the ColumnDataSource() correctly. Should the columns not be placed in a dict? From going through the code, this seems like it could be the problem with this code and the unknown attribute.
Is there something specific about the value attribute in the Bokeh movies main.py script? Or is my source not defined correctly?