Hi all
I would like to create a pie chart that have 5 wedge only :
1st - 4th: contains top 4 value
5th: contains the rest
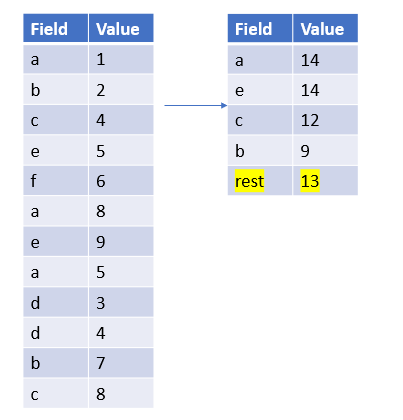
The problem here is how can i group the field column like above img, i would like to use left hand side table as ColumnDataSource then process it to right hand side table to draw pie chart as i need all the field for later filter
My current pie chart code :
def collection(table):
#Create a connection

connection = pyodbc.connect('DSN=$$$$;UID=$$$$$;PWD=$$$$$')

# Create a cursor from the connection

cursor = connection.cursor()

# Read data

df = pd.read_sql_query('select * from {0}'.format(table), con=connection)

# Remember to close the gate so that no issue when plays stuff with data

connection.close()

return df
df2 = collection(“D02_13_XT_MSLPAY_CMI_ACC”)
piechart1_dp = df2.groupby([“D02_12_TRANSACTIONS_CREATOR”]).sum()
x_pie1 = piechart1_dp.index.tolist()
piechart1_temp_val = piechart1_dp[“D02_12_SLM_CD_SC”].abs()
y_pie1 = piechart1_temp_val.tolist()
pie1_percen = 100*piechart1_temp_val / piechart1_temp_val.sum()
pie1_angle = (piechart1_temp_val / piechart1_temp_val.sum()) *2 *pi
source4 = ColumnDataSource(data=dict(x_values = x_pie1, y_values = y_pie1, percent = pie1_percen, angle = pie1_angle, color= viridis(len(x_pie1))))
original_source4 = ColumnDataSource(data=dict(x_values = x_pie1, y_values = y_pie1, percent = pie1_percen, angle = pie1_angle, color= viridis(len(x_pie1))))
pie1 = figure(plot_height=400, plot_width=360, toolbar_location=“right”, title = “Total value based on Creator”,
tools="hover, save", tooltips="@x_values: @y_values", x_range=(-0.5, 1.0))
pie1.wedge(x=0.25, y=0, radius=0.5,
		start_angle=cumsum('angle', include_zero=True), end_angle=cumsum('angle'),

		line_color="white", fill_color='color', source=source4)
pie1.axis.axis_label=None
pie1.axis.visible=False
pie1.grid.grid_line_color = None
``
My filter callback code:
combined_callback_code5= “”"
	var comp=msel.attributes.value;

	sc2.data['x_values']=[];

	sc2.data['y_values']=[];

	sc2.data['percent']=[];

	sc2.data['angle']=[];

	sc2.data['color']=[];

	var sum = 0;

	var count = 0;

	console.log("creator_test: " + comp);

	for (var i = 0; i <= source2.get_length(); i++){

			if (comp.indexOf(source2.data['x_values'][i]) >=0){

					sc2.data['x_values'][count] = source2.data['x_values'][i]

					sc2.data['y_values'][count] = source2.data['y_values'][i]

					sc2.data['color'][count] = source2.data['color'][i]

					sum = sum + source2.data['y_values'][i]

					console.log("sum_test" + sum)

					for (j = 0; j<= count; j++){

						console.log("test inside j loop: " + sc2.data['y_values'][j])

						sc2.data['angle'][j] = (sc2.data['y_values'][j] / sum) * 2 * Math.PI

						sc2.data['percent'][j] = (sc2.data['y_values'][j] / sum) * 100

					}

					count = count +1

			}

	}

	sc2.change.emit();
“”"
generic_callback_test2 = CustomJS(
	args=dict(source2=original_source4,

			  sc2=source4,

			  msel = creator_multiselect),

	code=combined_callback_code5

)
``
Thanks