Question - What's The Upper Limit For Datapoints in Bokeh?

I’ve been trying to create a similarity matrix, and it won’t render in the browser. In an effort to be sure I was getting the data set up properly, I switched to trying to render the data in a DataTable, and that would not show either.

In my searching, this link suggests that Bokeh can’t handle more than 10K data points. http://stackoverflow.com/questions/31571459/is-there-a-size-restriction-when-plotting-with-bokeh

My columns are 1.1MM rows. When I truncate the data to 500 rows, the DataTable renders, but the rectangle plot still does not. Is Bokeh incapable of handling this kind of problem, or should I be doing something differently?

Thanks for any help the group can provide.

I have plotted 100k points interactively in bokeh using webgl - but
you’re pushing the limits of the browser at that point.

here is an published example of 10k points:

Is Bokeh incapable of handling this kind of problem, or should
I be doing something differently?
My general answer is that Bokeh is capable and you probably should
be doing something differently.
Having said that it is impossible to answer this question accurately
without seeing specifically what “this” or knowing what you are
doing. Please do post some sample data and code so we can get to the
bottom of your problem.
A very common source of problems is “ragged data” that is you’ve
passed in data of different lengths. Bokeh tries to warn about this,
but sometimes fails.

···

https://bokeh.github.io/blog/2016/6/28/release-0-12-1/

On 9/2/16 2:16 PM, Greg Hayes wrote:

    I've been trying to create a similarity matrix, and

it won’t render in the browser. In an effort to be sure I was
getting the data set up properly, I switched to trying to render
the data in a DataTable, and that would not show either.

      In my searching, this link suggests that Bokeh can't handle

more than 10K data points. http://stackoverflow.com/questions/31571459/is-there-a-size-restriction-when-plotting-with-bokeh

      My columns are 1.1MM rows.  When I truncate the data to 500

rows, the DataTable renders, but the rectangle plot still does
not. Is Bokeh incapable of handling this kind of problem, or
should I be doing something differently?

Thanks for any help the group can provide.

  You received this message because you are subscribed to the Google

Groups “Bokeh Discussion - Public” group.

  To unsubscribe from this group and stop receiving emails from it,

send an email to [email protected].

  To post to this group, send email to [email protected].

  To view this discussion on the web visit [https://groups.google.com/a/continuum.io/d/msgid/bokeh/0c6ee176-3397-4b33-b286-22477b0452d8%40continuum.io](https://groups.google.com/a/continuum.io/d/msgid/bokeh/0c6ee176-3397-4b33-b286-22477b0452d8%40continuum.io?utm_medium=email&utm_source=footer).

  For more options, visit [https://groups.google.com/a/continuum.io/d/optout](https://groups.google.com/a/continuum.io/d/optout).


Sarah Bird
Developer, Bokeh

    [
      ![Continuum Analytics](http://docs.continuum.io/_static/img/ContinuumWordmark.png)
    ](http://continuum.io)

Thanks for the response.

The following code replicates what I’m trying to do. I put it together in Jupyter notebook, but it renders the same (if at all) if I run it as standalone code. I also attached a copy of the notebook file, if that helps.

import numpy as np

from bokeh.plotting import figure

from bokeh.io import show, output_notebook

from bokeh.models import ColumnDataSource

output_notebook()

similarity_matrix = np.random.rand(3500, 3500)

labels=

for i in range(1, 3500, 1):

labels.append(str(i))

x =

y =

color =

alpha =

for i, node1 in enumerate(labels):

for j, node2 in enumerate(labels):

x.append(node1)

y.append(node2)

alpha.append(min(similarity_matrix[i,j]/4.0, 0.0) + 0.1)

if similarity_matrix[i,j] > 0.2:

color.append(“red”)

else:

color.append(“blue”)

source = ColumnDataSource(data=dict(x=x, y=y, colors=color, fill_alpha=alpha))

p = figure(width=800, height=800)

p.rect(“x”, “y”, source=source, color=“colors”, alpha=“fill_alpha”)

show(p)

``

test_code.ipynb (7.63 KB)

···

On Friday, September 2, 2016 at 4:49:26 PM UTC-5, Sarah Bird wrote:

I have plotted 100k points interactively in bokeh using webgl - but

you’re pushing the limits of the browser at that point.

here is an published example of 10k points:

https://bokeh.github.io/blog/2016/6/28/release-0-12-1/

> Is Bokeh incapable of handling this kind of problem, or should

I be doing something differently?

My general answer is that Bokeh is capable and you probably should

be doing something differently.

Having said that it is impossible to answer this question accurately

without seeing specifically what “this” or knowing what you are
doing. Please do post some sample data and code so we can get to the
bottom of your problem.

A very common source of problems is "ragged data" that is you've

passed in data of different lengths. Bokeh tries to warn about this,
but sometimes fails.

On 9/2/16 2:16 PM, Greg Hayes wrote:

    I've been trying to create a similarity matrix, and

it won’t render in the browser. In an effort to be sure I was
getting the data set up properly, I switched to trying to render
the data in a DataTable, and that would not show either.

      In my searching, this link suggests that Bokeh can't handle

more than 10K data points. http://stackoverflow.com/questions/31571459/is-there-a-size-restriction-when-plotting-with-bokeh

      My columns are 1.1MM rows.  When I truncate the data to 500

rows, the DataTable renders, but the rectangle plot still does
not. Is Bokeh incapable of handling this kind of problem, or
should I be doing something differently?

Thanks for any help the group can provide.

  You received this message because you are subscribed to the Google

Groups “Bokeh Discussion - Public” group.

  To unsubscribe from this group and stop receiving emails from it,

send an email to [email protected].

  To post to this group, send email to [email protected].

  To view this discussion on the web visit [https://groups.google.com/a/continuum.io/d/msgid/bokeh/0c6ee176-3397-4b33-b286-22477b0452d8%40continuum.io](https://groups.google.com/a/continuum.io/d/msgid/bokeh/0c6ee176-3397-4b33-b286-22477b0452d8%40continuum.io?utm_medium=email&utm_source=footer).

  For more options, visit [https://groups.google.com/a/continuum.io/d/optout](https://groups.google.com/a/continuum.io/d/optout).


Sarah Bird
Developer, Bokeh

    [
      <img alt="Continuum Analytics" src="https://lh6.googleusercontent.com/proxy/VYgVjggTk1hCXSN9wFkffE3I6kxTvJ51tT4KvDXOuKbs1WyFG66k7kt2-vkDimbyxfWtP-d1paJmstMYhPPnDYSUF4rLPoYM2GM2QFM=w5000-h5000" style="width:150px;min-height:30px" height="30px" width="150px">
    ](http://continuum.io)
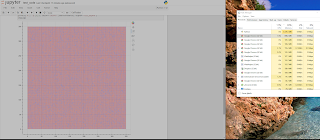
I cut your size to 100,100 to make it faster to test (the 3500 example is pretty heavy).
Your p.rect syntax was wrong - I could plot p.circle though, so I did some digging and…

p.rect(“x”, “y”,1,1, color=“colors”,source=source, alpha=“fill_alpha”)

``

the extra “1,1” specify the width and height of your rectangles.

May need to consider that 800x800 pixels for your figure isn’t big enough for 3500x3500 input? The resulting len(colors) is over 12 million.
For 350x350, its 121,000 and thats pushing it - Chrome is registering 1GB RAM usage for that tab alone, python is sitting on over 3GB of RAM usage for the notebook.

Maybe use datashader to downsample the data for your needs?

···

On Saturday, 3 September 2016 01:46:46 UTC+1, Greg Hayes wrote:

Thanks for the response.

The following code replicates what I’m trying to do. I put it together in Jupyter notebook, but it renders the same (if at all) if I run it as standalone code. I also attached a copy of the notebook file, if that helps.

import numpy as np

from bokeh.plotting import figure

from bokeh.io import show, output_notebook

from bokeh.models import ColumnDataSource

output_notebook()

similarity_matrix = np.random.rand(3500, 3500)

labels=

for i in range(1, 3500, 1):

labels.append(str(i))

x =

y =

color =

alpha =

for i, node1 in enumerate(labels):

for j, node2 in enumerate(labels):

x.append(node1)

y.append(node2)

alpha.append(min(similarity_matrix[i,j]/4.0, 0.0) + 0.1)

if similarity_matrix[i,j] > 0.2:

color.append(“red”)

else:

color.append(“blue”)

source = ColumnDataSource(data=dict(x=x, y=y, colors=color, fill_alpha=alpha))

p = figure(width=800, height=800)

p.rect(“x”, “y”, source=source, color=“colors”, alpha=“fill_alpha”)

show(p)

``

On Friday, September 2, 2016 at 4:49:26 PM UTC-5, Sarah Bird wrote:

I have plotted 100k points interactively in bokeh using webgl - but

you’re pushing the limits of the browser at that point.

here is an published example of 10k points:

https://bokeh.github.io/blog/2016/6/28/release-0-12-1/

> Is Bokeh incapable of handling this kind of problem, or should

I be doing something differently?

My general answer is that Bokeh is capable and you probably should

be doing something differently.

Having said that it is impossible to answer this question accurately

without seeing specifically what “this” or knowing what you are
doing. Please do post some sample data and code so we can get to the
bottom of your problem.

A very common source of problems is "ragged data" that is you've

passed in data of different lengths. Bokeh tries to warn about this,
but sometimes fails.

On 9/2/16 2:16 PM, Greg Hayes wrote:

    I've been trying to create a similarity matrix, and

it won’t render in the browser. In an effort to be sure I was
getting the data set up properly, I switched to trying to render
the data in a DataTable, and that would not show either.

      In my searching, this link suggests that Bokeh can't handle

more than 10K data points. http://stackoverflow.com/questions/31571459/is-there-a-size-restriction-when-plotting-with-bokeh

      My columns are 1.1MM rows.  When I truncate the data to 500

rows, the DataTable renders, but the rectangle plot still does
not. Is Bokeh incapable of handling this kind of problem, or
should I be doing something differently?

Thanks for any help the group can provide.

  You received this message because you are subscribed to the Google

Groups “Bokeh Discussion - Public” group.

  To unsubscribe from this group and stop receiving emails from it,

send an email to [email protected].

  To post to this group, send email to [email protected].

  To view this discussion on the web visit [https://groups.google.com/a/continuum.io/d/msgid/bokeh/0c6ee176-3397-4b33-b286-22477b0452d8%40continuum.io](https://groups.google.com/a/continuum.io/d/msgid/bokeh/0c6ee176-3397-4b33-b286-22477b0452d8%40continuum.io?utm_medium=email&utm_source=footer).

  For more options, visit [https://groups.google.com/a/continuum.io/d/optout](https://groups.google.com/a/continuum.io/d/optout).


Sarah Bird
Developer, Bokeh

    [
      <img alt="Continuum Analytics" src="https://lh6.googleusercontent.com/proxy/VYgVjggTk1hCXSN9wFkffE3I6kxTvJ51tT4KvDXOuKbs1WyFG66k7kt2-vkDimbyxfWtP-d1paJmstMYhPPnDYSUF4rLPoYM2GM2QFM=w5000-h5000" style="width:150px;min-height:30px" height="30px" width="150px">
    ](http://continuum.io)

Can I add any interactive glyphs to such graphs?
Like taptools to callback.
Actually I wanted to plot a 300 k points on a map and want to add taptool callback to every glyph is it possible with bokeh?

···

On Saturday, September 3, 2016 at 3:19:26 AM UTC+5:30, Sarah Bird wrote:

I have plotted 100k points interactively in bokeh using webgl - but

you’re pushing the limits of the browser at that point.

here is an published example of 10k points:

https://bokeh.github.io/blog/2016/6/28/release-0-12-1/

> Is Bokeh incapable of handling this kind of problem, or should

I be doing something differently?

My general answer is that Bokeh is capable and you probably should

be doing something differently.

Having said that it is impossible to answer this question accurately

without seeing specifically what “this” or knowing what you are
doing. Please do post some sample data and code so we can get to the
bottom of your problem.

A very common source of problems is "ragged data" that is you've

passed in data of different lengths. Bokeh tries to warn about this,
but sometimes fails.

On 9/2/16 2:16 PM, Greg Hayes wrote:

    I've been trying to create a similarity matrix, and

it won’t render in the browser. In an effort to be sure I was
getting the data set up properly, I switched to trying to render
the data in a DataTable, and that would not show either.

      In my searching, this link suggests that Bokeh can't handle

more than 10K data points. http://stackoverflow.com/questions/31571459/is-there-a-size-restriction-when-plotting-with-bokeh

      My columns are 1.1MM rows.  When I truncate the data to 500

rows, the DataTable renders, but the rectangle plot still does
not. Is Bokeh incapable of handling this kind of problem, or
should I be doing something differently?

Thanks for any help the group can provide.

  You received this message because you are subscribed to the Google

Groups “Bokeh Discussion - Public” group.

  To unsubscribe from this group and stop receiving emails from it,

send an email to [email protected].

  To post to this group, send email to [email protected].

  To view this discussion on the web visit [https://groups.google.com/a/continuum.io/d/msgid/bokeh/0c6ee176-3397-4b33-b286-22477b0452d8%40continuum.io](https://groups.google.com/a/continuum.io/d/msgid/bokeh/0c6ee176-3397-4b33-b286-22477b0452d8%40continuum.io?utm_medium=email&utm_source=footer).

  For more options, visit [https://groups.google.com/a/continuum.io/d/optout](https://groups.google.com/a/continuum.io/d/optout).


Sarah Bird
Developer, Bokeh

    [
      <img alt="Continuum Analytics" src="https://lh6.googleusercontent.com/proxy/VYgVjggTk1hCXSN9wFkffE3I6kxTvJ51tT4KvDXOuKbs1WyFG66k7kt2-vkDimbyxfWtP-d1paJmstMYhPPnDYSUF4rLPoYM2GM2QFM=w5000-h5000" style="width:150px;min-height:30px" height="30px" width="150px">
    ](http://continuum.io)

Hi,

There's not clean answer for this. Browsers canvas implementations can vary greatly in performance in specific use cases, and they also all have different memory limits that that will cause them to fall over if you go past. As Sarah said 100k is starting to push limits of most browsers. You might find with webgl that things are better. But I believe 300k is simply going to be too much for pure Bokeh and pretty much any browser. At that point you should consider Datashader (http://datashader.org/\) together with Bokeh.

Thanks,

Bryan

···

On Mar 22, 2018, at 04:03, avinash magar <[email protected]> wrote:

Can I add any interactive glyphs to such graphs?
Like taptools to callback.
Actually I wanted to plot a 300 k points on a map and want to add taptool callback to every glyph is it possible with bokeh?

On Saturday, September 3, 2016 at 3:19:26 AM UTC+5:30, Sarah Bird wrote:
I have plotted 100k points interactively in bokeh using webgl - but you're pushing the limits of the browser at that point.

here is an published example of 10k points: https://bokeh.github.io/blog/2016/6/28/release-0-12-1/

> Is Bokeh incapable of handling this kind of problem, or should I be doing something differently?

My general answer is that Bokeh is capable and you probably should be doing something differently.

Having said that it is impossible to answer this question accurately without seeing specifically what "this" or knowing what you are doing. Please do post some sample data and code so we can get to the bottom of your problem.

A very common source of problems is "ragged data" that is you've passed in data of different lengths. Bokeh tries to warn about this, but sometimes fails.

On 9/2/16 2:16 PM, Greg Hayes wrote:

I've been trying to create a similarity matrix, and it won't render in the browser. In an effort to be sure I was getting the data set up properly, I switched to trying to render the data in a DataTable, and that would not show either.

In my searching, this link suggests that Bokeh can't handle more than 10K data points. python 3.x - Is there a size restriction when plotting with Bokeh? - Stack Overflow

My columns are 1.1MM rows. When I truncate the data to 500 rows, the DataTable renders, but the rectangle plot still does not. Is Bokeh incapable of handling this kind of problem, or should I be doing something differently?

Thanks for any help the group can provide.
--
You received this message because you are subscribed to the Google Groups "Bokeh Discussion - Public" group.
To unsubscribe from this group and stop receiving emails from it, send an email to bokeh+un...@continuum.io.
To post to this group, send email to bo...@continuum.io.
To view this discussion on the web visit https://groups.google.com/a/continuum.io/d/msgid/bokeh/0c6ee176-3397-4b33-b286-22477b0452d8%40continuum.io\.
For more options, visit https://groups.google.com/a/continuum.io/d/optout\.

--
Sarah Bird
Developer, Bokeh

--
You received this message because you are subscribed to the Google Groups "Bokeh Discussion - Public" group.
To unsubscribe from this group and stop receiving emails from it, send an email to [email protected].
To post to this group, send email to [email protected].
To view this discussion on the web visit https://groups.google.com/a/continuum.io/d/msgid/bokeh/ae0b1c6a-536e-4ea8-966d-6f373276de83%40continuum.io\.
For more options, visit https://groups.google.com/a/continuum.io/d/optout\.