What are you trying to do?
I am trying to execute a CustomJS callback, or a series of callbacks, that will change the data of a CDS AND update the x_range/y_range bounds to fixed/set values. For my example I’ll just focus on x_range for simplicity:
The initialized x_range is “default”, i.e. a DataRange1d that will follow all renderers. The user may or may not, prior to triggering the callback, use pan/zoom and thereby hard-set the axis bounds. (Don’t think that matters but pointing it out just in case).
What have you tried that did NOT work as expected?
I’ve got three very similar MRES:
- Most basic → update data and x_range.start in the same callback:
from bokeh.plotting import figure,save
from bokeh.layouts import column
from bokeh.models import ColumnDataSource, CustomJS, Range1d, Button

src = ColumnDataSource(data={'x':[0,1],'y':[0,1]})


newdata = {'x':[0,1,2],'y':[2,3,5]}
f = figure()
r = f.line(x='x',y='y',source=src)


dbtn = Button(label='addData')
data_cb = CustomJS(args=dict(newdata=newdata,src=src,f=f)
              ,code='''
              f.x_range.start = -5
              src.data=newdata
              '''
              )

dbtn.js_on_click(data_cb)

save(column([f,dbtn]),'test.html')
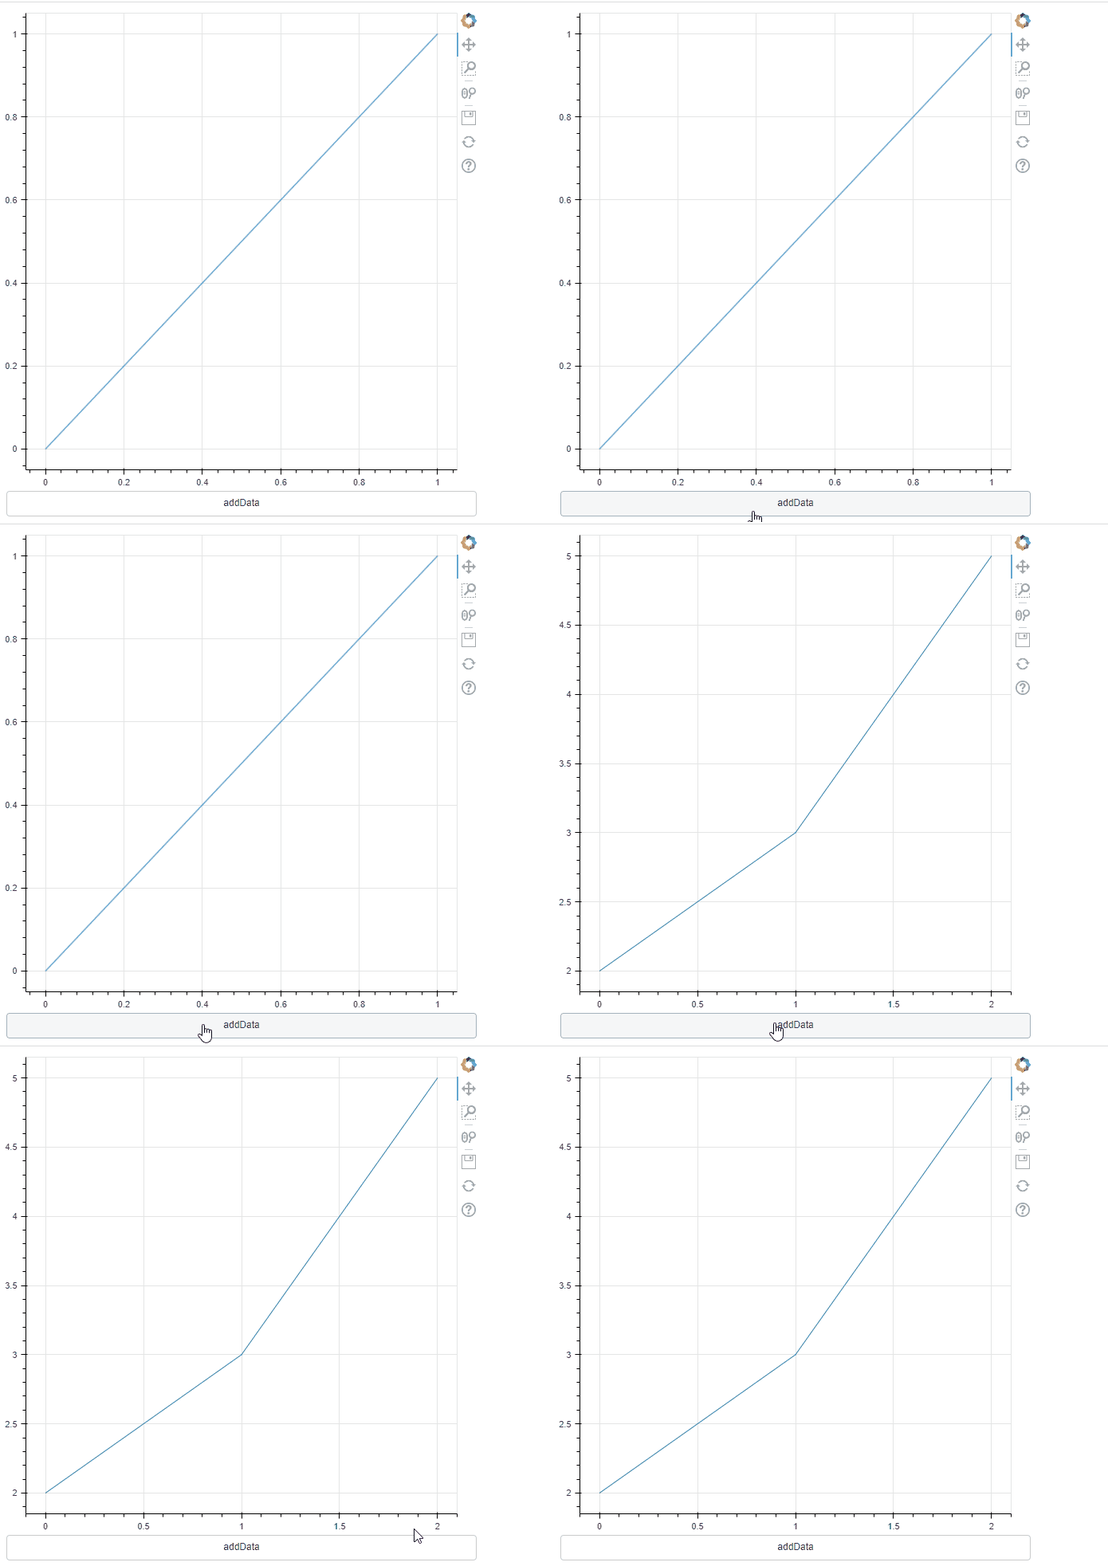
The cds.data update takes precedent, and the update to x_range.start is ignored.

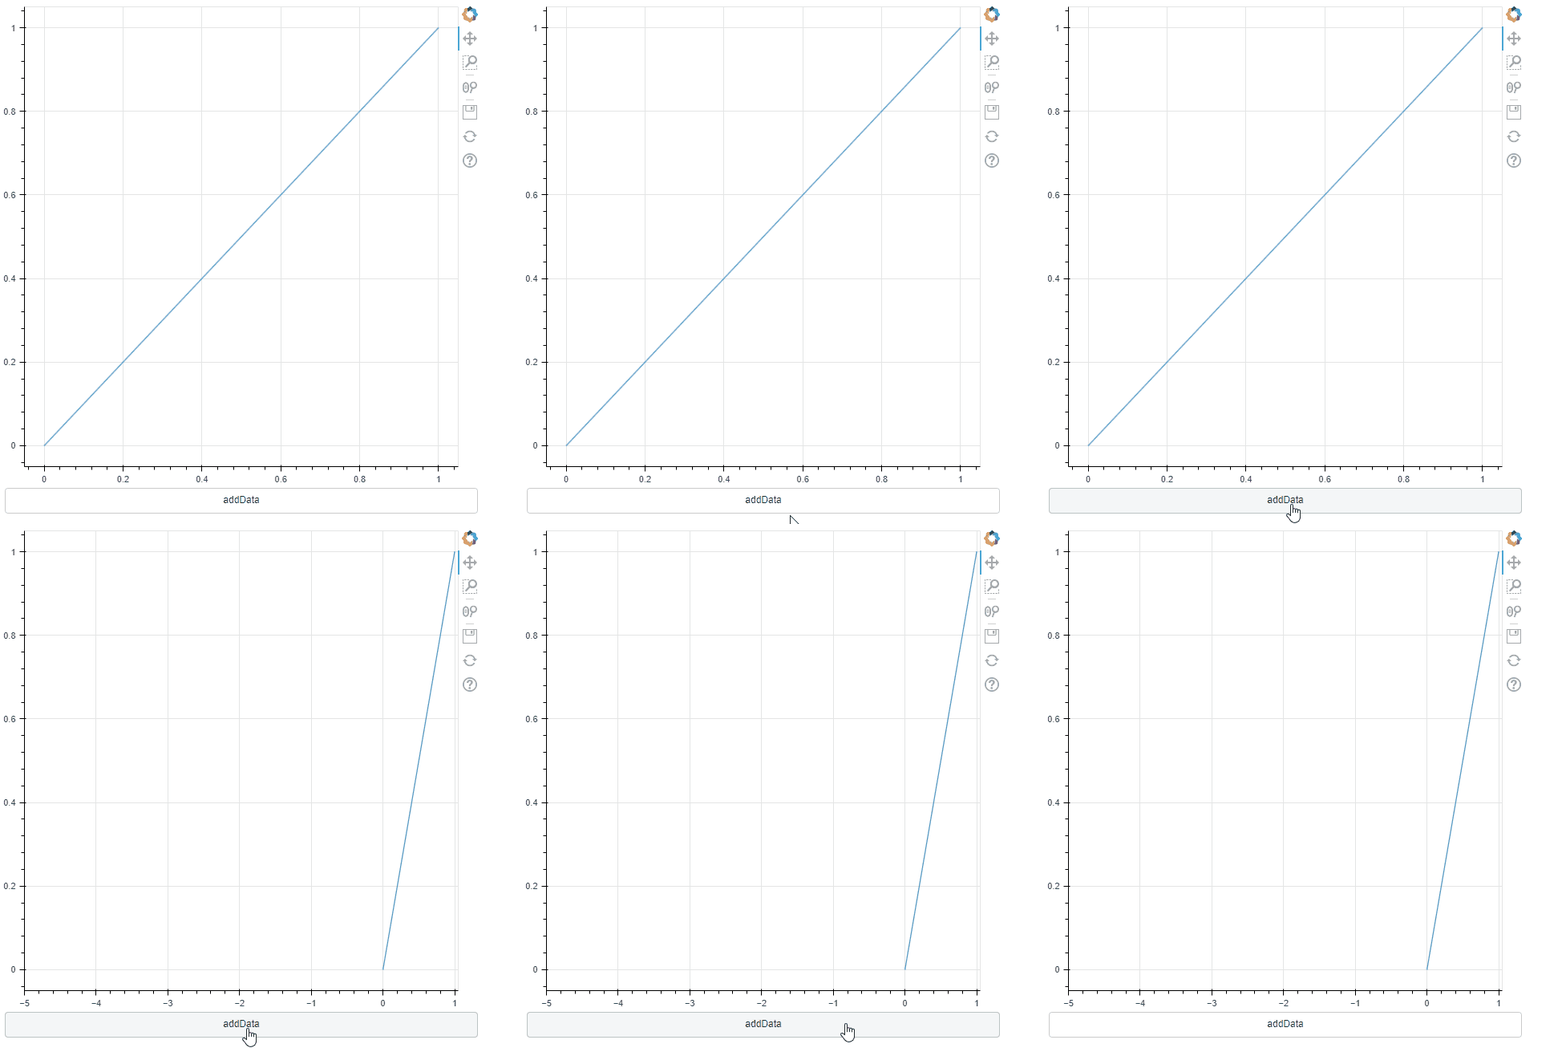
If you comment out the src.data=newdata line in data_cb, the f.x_range.start = -5 will be followed:

- Instantiate a Range1d object, pass it to the CustomJS, and update the figure’s x_range with it:
from bokeh.plotting import figure,save
from bokeh.layouts import column
from bokeh.models import ColumnDataSource, CustomJS, Range1d, Button

src = ColumnDataSource(data={'x':[0,1],'y':[0,1]})


newdata = {'x':[0,1,2],'y':[2,3,5]}
f = figure()
r = f.line(x='x',y='y',source=src)


xr = Range1d(start=-5,end=1)

dbtn = Button(label='addData')
data_cb = CustomJS(args=dict(newdata=newdata,src=src,f=f,xr=xr)
              ,code='''
              f.x_range = xr
              console.log(f.x_range.start)

              //src.data=newdata
              '''
              )

dbtn.js_on_click(data_cb)

save(column([f,dbtn]),'test.html')
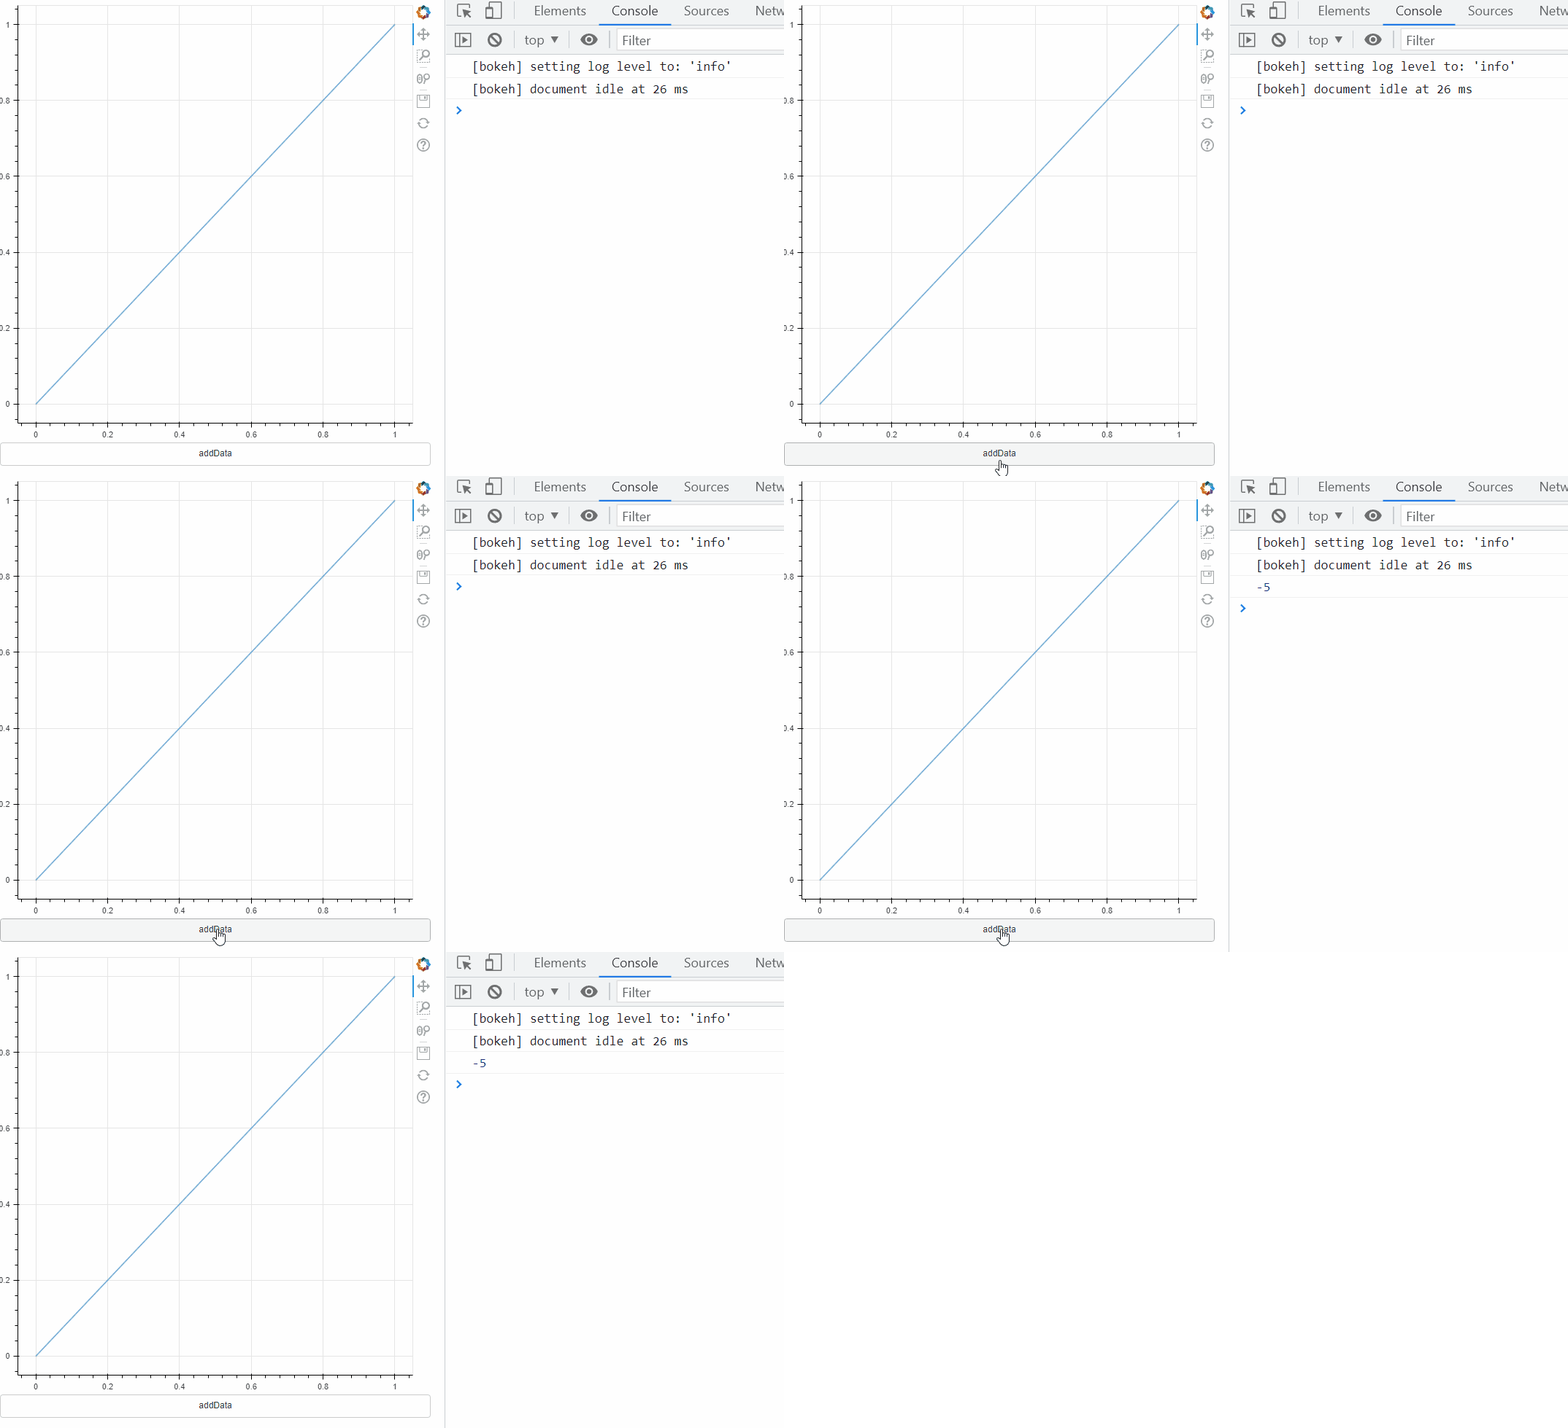
This doesn’t work at all, even not bothering with the data update doesn’t trigger a re-render of the new range. The console.log does show that the figure’s x_range does get updated, but no re-render occurs! FYI I also tried a bunch .change.emit()s on the figure, the x_range, the figure’s properties etc.

- Make two callbacks:
from bokeh.plotting import figure,save
from bokeh.layouts import column
from bokeh.models import ColumnDataSource, CustomJS, Range1d, Button

src = ColumnDataSource(data={'x':[0,1],'y':[0,1]})


newdata = {'x':[0,1,2],'y':[2,3,5]}
f = figure()
r = f.line(x='x',y='y',source=src)


dbtn = Button(label='addData')
data_cb = CustomJS(args=dict(newdata=newdata,src=src,f=f)
              ,code='''
              src.data=newdata
              console.log(f.x_range.start)
              '''
              )
rng_cb = CustomJS(args=dict(f=f)
              ,code='''
              f.x_range.start=-5
              console.log(f.x_range.start)
              '''
              )

dbtn.js_on_click(data_cb)
dbtn.js_on_click(rng_cb)
save(column([f,dbtn]),'test.html')
Result was same as 1.
Is this intended behaviour for reasons beyond me, is it a bug, and most importantly, is there a workaround?
Thanks…