I have a plot and I need the ranges of that plot to generate a calculation. I used a simple callback to get the range. My x-axis is a datetime and I expected the callback to return a datetime, but instead, it’s returning a float. Where is this float coming from and how can I convert it back to a datetime?
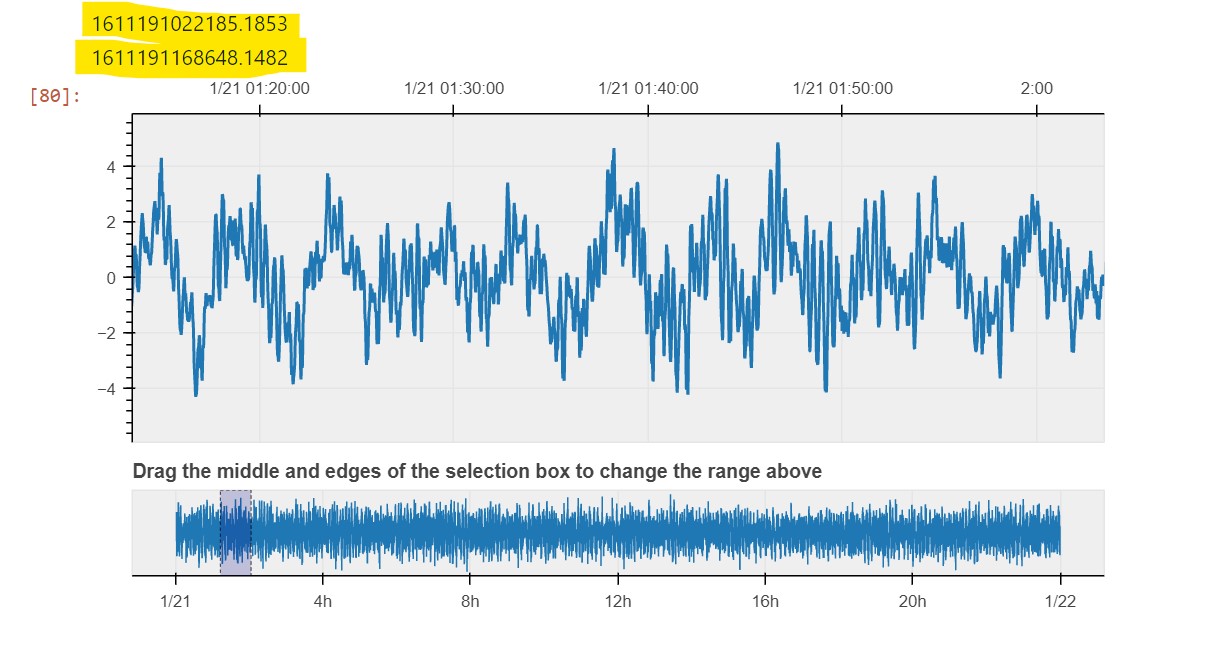
This is a screenshot of the plot with the callback value printed at the top:
The floating point value you show looks like the time since the Unix epoch in milliseconds.
Here is an illustrative example to show how to print it in a standard timestamp representation; two options are shown depending on what level of precision you want to reveal. NB: if you want it in a different format, there are numerous built-in string representation methods to format the timestamps to your requirement.
import numpy as np

t = 1611191022185.1853

ts_ms = int(t)

ts_ns = int(t*1e6)

print(np.datetime64(ts_ms, 'ms'))
2021-01-21T01:03:42.185

print(np.datetime64(ts_ns, 'ns'))
2021-01-21T01:03:42.185185280
Yes, exactly, that is the underlying representation of datetime values in bokeh. We try to preserve user-supplied types where we can but the cross-runtime nature of Bokeh makes that a challenge sometimes.