I ended up going with ly_crect:
legend_data = list(legend_values = c(-0.545923348, -0.319339005,
-0.092754662, 0.133829681, 0.360414024, 0.586998367, 0.81358271,
1.040167053, 1.266751396, 1.493335739), width = c(0.22658,
0.22658, 0.22658, 0.22658, 0.22658, 0.22658, 0.22658, 0.22658,
0.22658, 0.22658), legend_colors = c(1L, 2L, 3L, 10L, 9L,
8L, 7L, 6L, 5L, 4L), y = c(1, 1, 1, 1, 1, 1, 1, 1, 1, 1))
legend = figure(height=150, tools=NULL, xlab=“Legend”, ygrid=FALSE, xgrid=FALSE,xaxes=TRUE, yaxes=FALSE , xlim=r) %>% ly_crect(x=legend_values,y=y, data=legend_data,color=legend_colors,width=width, line_alpha=0,fill_alpha=fill_alpha)
···
On Thursday, January 21, 2016 at 3:12:25 PM UTC-8, jeremiah rounds wrote:
Hi,
rbokeh question.
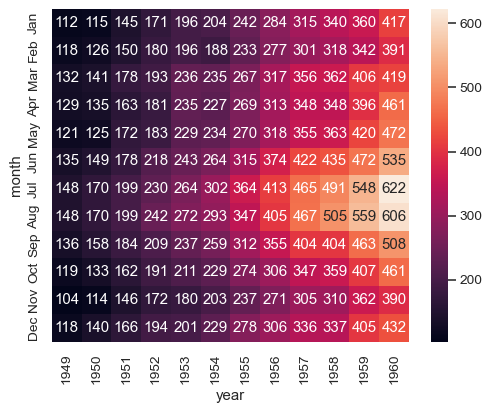
I implemented a heatmap with ly_crect, but now I need to make a legend.
The legend is going to take the form of something like the color gradient:
http://www.r-bloggers.com/r-user-group-recap-heatmaps-and-using-the-caret-package/
The question is:
- what basic rbokeh layer do you recommend to do this sort of color gradient?
- Is there any positioning tricks to get a small figure offset from a larger one?
Because the “legend” with “heatmap” is intended to go together in a Trelliscope display, I have to somehow get the two to be in one rbokeh figure.
Thanks,
Jeremiah