Hi,
Autonoe:
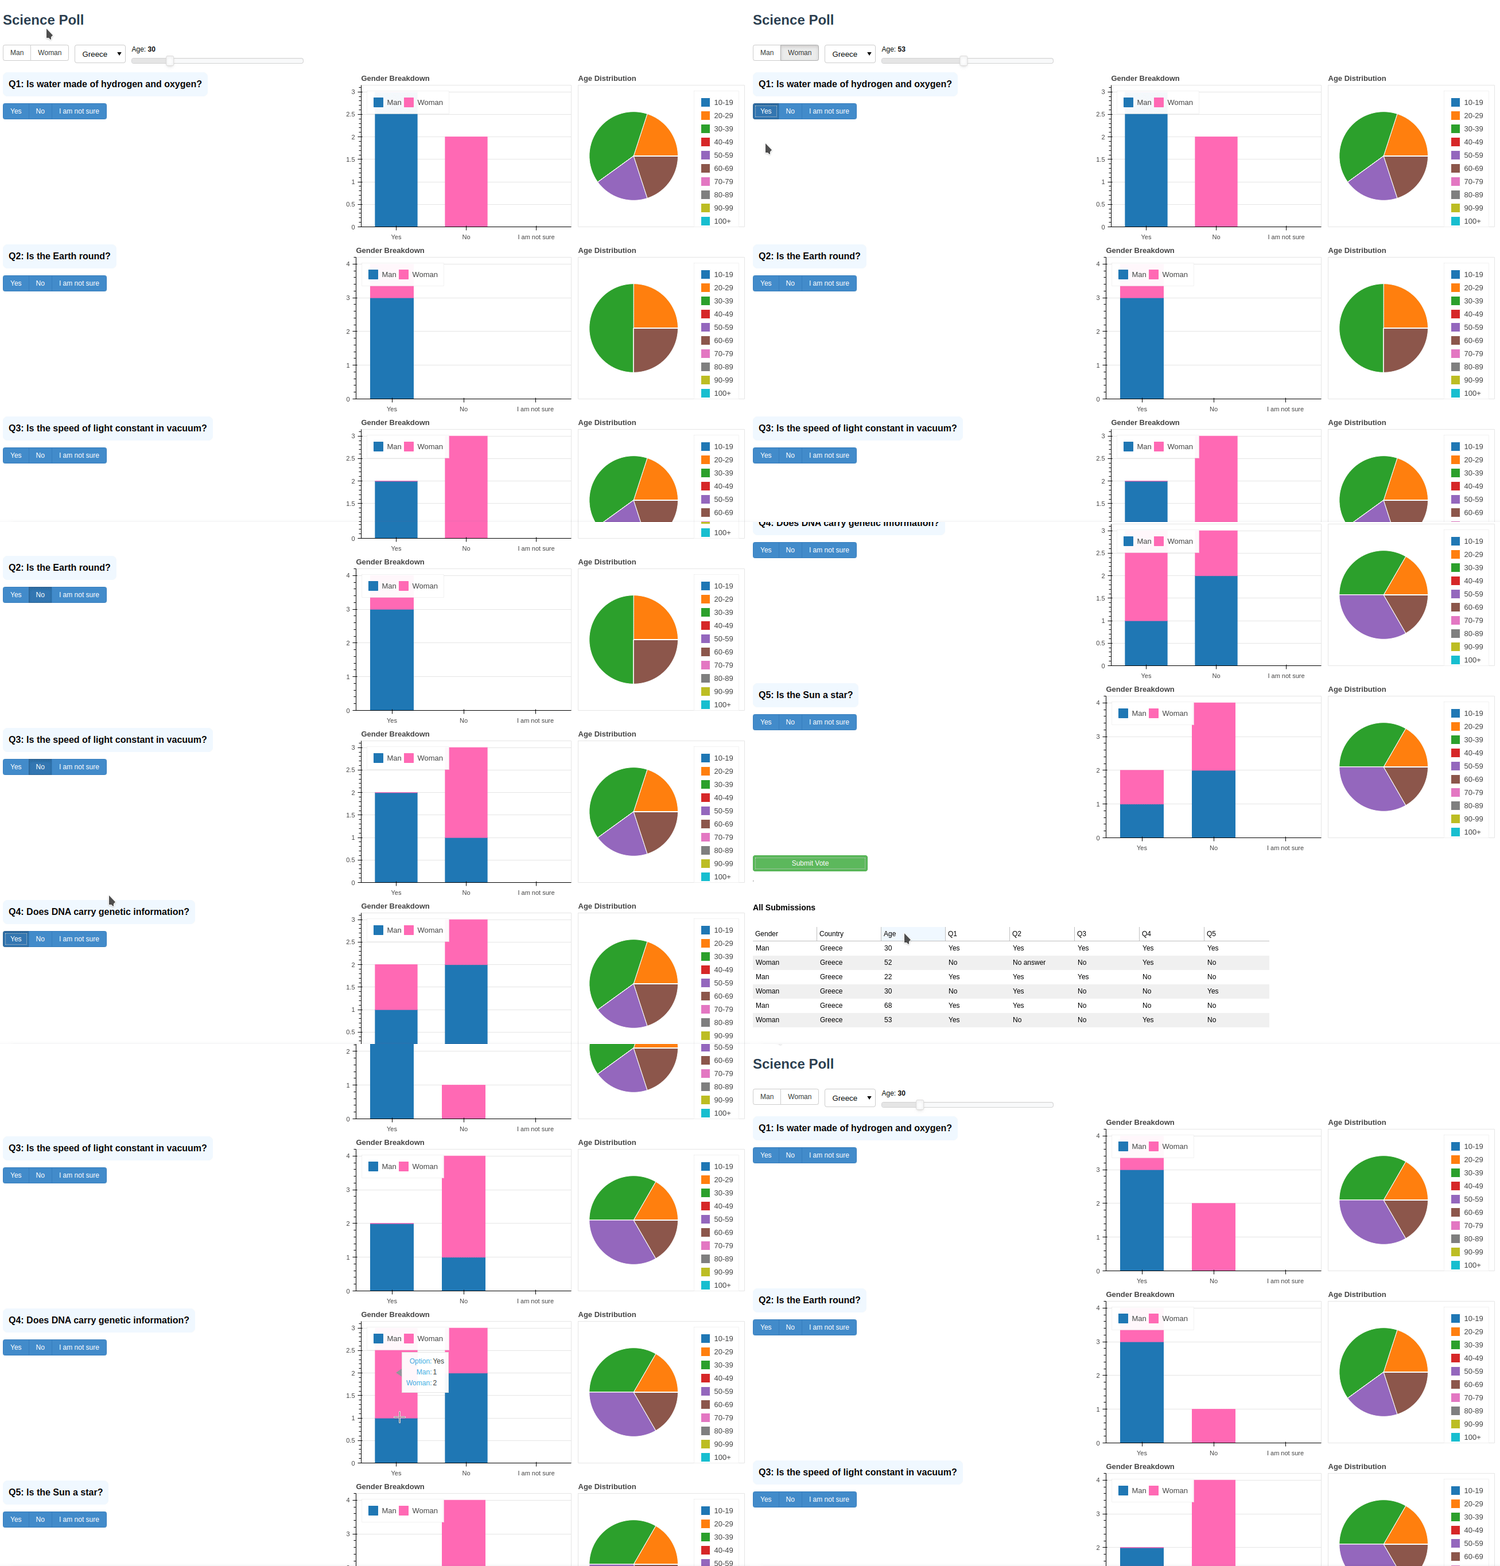
This app lets users answer a short science quiz and immediately see the results broken down by gender and age group, while storing every response in a table for further analysis.

# autonoe.py
from math import pi

from bokeh.io import curdoc
from bokeh.models import (
    ColumnDataSource, RadioButtonGroup, Select, Slider,
    Button, Div, DataTable, TableColumn, Spacer, HoverTool
)
from bokeh.plotting import figure
from bokeh.layouts import column, row
from bokeh.palettes import Category10
from bokeh.transform import cumsum

# --- 1) Questions & options ---
questions = [
    "Is water made of hydrogen and oxygen?",
    "Is the Earth round?",
    "Is the speed of light constant in vacuum?",
    "Does DNA carry genetic information?",
    "Is the Sun a star?"
]
options = ["Yes", "No", "I am not sure"]

# --- 2) Demographics widgets ---
gender_select = RadioButtonGroup(labels=["Man", "Woman"], active=None)
country_select = Select(
     value="Greece",
    options=["Greece", "USA", "UK", "Germany", "France", "Other"]
)
age_slider = Slider(start=10, end=100, value=30, step=1, title="Age")

# --- 3) Age bins & palette ---
age_groups = [f"{i*10}-{i*10+9}" for i in range(1,10)] + ["100+"]
palette = Category10[len(age_groups)]

# --- 4) Prepare data sources & plot objects ---
gender_sources = []
age_sources    = []
radio_groups   = []
question_panels = []

for i, q in enumerate(questions):
    # DataSources
    src_g = ColumnDataSource(data=dict(option=options, Man=[0]*3, Woman=[0]*3))
    src_a = ColumnDataSource(data=dict(
        age_group=age_groups,
        count=[0]*len(age_groups),
        angle=[0]*len(age_groups),
        color=palette
    ))
    gender_sources.append(src_g)
    age_sources.append(src_a)

    # Radio widget
    rb = RadioButtonGroup(labels=options, active=None, button_type="primary")
    radio_groups.append(rb)

    # Stacked‐bar chart
    p_bar = figure(
        x_range=options, height=300, width=400,
        title="Gender Breakdown",
        toolbar_location=None, tools=""
    )
    bars = p_bar.vbar_stack(
        stackers=["Man", "Woman"],
        x='option', width=0.6,
        color=["#1f77b4", "#ff69b4"],
        source=src_g,
        legend_label=["Man", "Woman"]
    )
    p_bar.y_range.start = 0
    p_bar.xgrid.grid_line_color = None
    p_bar.legend.location = "top_left"
    p_bar.legend.orientation = "horizontal"
    p_bar.add_tools(HoverTool(renderers=bars, tooltips=[
        ("Option", "@option"),
        ("Man", "@Man"),
        ("Woman", "@Woman")
    ]))

    # Pie chart
    p_pie = figure(
        height=300, width=300,
        title="Age Distribution",
        toolbar_location=None,
        tools="hover",
        tooltips="@age_group: @count",
        x_range=(-0.5, 1.0)
    )
    p_pie.wedge(
        x=0, y=1, radius=0.4,
        start_angle=cumsum('angle', include_zero=True),
        end_angle=cumsum('angle'),
        line_color="white", fill_color='color',
        legend_field='age_group',
        source=src_a
    )
    p_pie.axis.visible = False
    p_pie.grid.grid_line_color = None

    # Assemble each question’s panel with tighter spacing
    question_div = Div(text=f"""
        <div style="
            background: #f0f8ff;
            border-radius: 8px;
            padding: 10px;
            margin-bottom: 2px;
            font-size: 16px;
            font-weight: bold;
        ">
            Q{i+1}: {q}
        </div>
    """ )
    left_col = column(question_div, rb, sizing_mode="stretch_width", width=5)
    right_col = row(p_bar, p_pie, sizing_mode="stretch_width", spacing=2)
    panel = row(left_col, right_col, width=1200)
    question_panels.append(panel)

# --- 5) Submission table ---
submissions_source = ColumnDataSource(data={
    "Gender": [], "Country": [], "Age": [],
    **{f"Q{i+1}": [] for i in range(len(questions))}
})
columns = [
    TableColumn(field="Gender",  title="Gender"),
    TableColumn(field="Country", title="Country"),
    TableColumn(field="Age",     title="Age"),
] + [
    TableColumn(field=f"Q{i+1}", title=f"Q{i+1}")
    for i in range(len(questions))
]
data_table = DataTable(
    source=submissions_source,
    columns=columns,
    width=900, height=200,
    index_position=None
)

# --- 6) Submit callback ---
def submit():
    if gender_select.active is None:
        return
    gender  = gender_select.labels[gender_select.active]
    country = country_select.value
    age     = age_slider.value

    # compute age bin
    bin_label = "100+" if age >= 100 else f"{(age//10)*10}-{(age//10)*10+9}"

    # collect and record answers
    answers = []
    for i, rb in enumerate(radio_groups):
        sel = rb.active
        ans = options[sel] if sel is not None else "No answer"
        answers.append(ans)

        if ans in options:
            # update gender bar
            src_g = gender_sources[i]
            dg = dict(src_g.data)
            dg[gender][options.index(ans)] += 1
            src_g.data = dg

            # update age pie
            src_a = age_sources[i]
            da = dict(src_a.data)
            idx = da["age_group"].index(bin_label)
            da["count"][idx] += 1
            total = sum(da["count"])
            da["angle"] = [c/total * 2*pi for c in da["count"]]
            src_a.data = da

    # append to table
    old = submissions_source.data
    new = {
        "Gender":  old["Gender"]  + [gender],
        "Country": old["Country"] + [country],
        "Age":     old["Age"]     + [age],
        **{f"Q{i+1}": old[f"Q{i+1}"] + [answers[i]] for i in range(len(questions))}
    }
    submissions_source.data = new

    # reset form
    gender_select.active = None
    country_select.value = "Greece"
    age_slider.value = 30
    for rb in radio_groups:
        rb.active = None

submit_btn = Button(label="Submit Vote", button_type="success", width=200)
submit_btn.on_click(submit)

# --- 7) Build the final layout ---
header = Div(text="<h1 style='font-family:Helvetica; color:#2c3e50;'>Science Poll</h1>")
demographics = row(
     gender_select,
     country_select,
     age_slider,
    Spacer(height=10),
    sizing_mode="stretch_width"
)

layout = column(
    header,
    demographics,
    *question_panels,
    submit_btn,
    Div(text="<hr>"),
    Div(text="<h3>All Submissions</h3>"),
    data_table,
    sizing_mode="stretch_width",
    margin=(1,1,1,1)
)

curdoc().title = "Autonoe: Science Poll"
curdoc().add_root(layout)
bokeh serve --show autonoe.py