I’m working on a time-series chart that should support different time-zones. Once the time zone is changed, the section of the chart that is being viewed shifts.
I would like to keep the reference viewing area constant, meaning, whenever I switch from UTC+01:00 (London) to UTC+03:00 (Istanbul) for example, I would like to re-center the portion of the chart that was displayed before.
Right now, I have a solution for this but it seems to be a bit crude. Here is the solution:
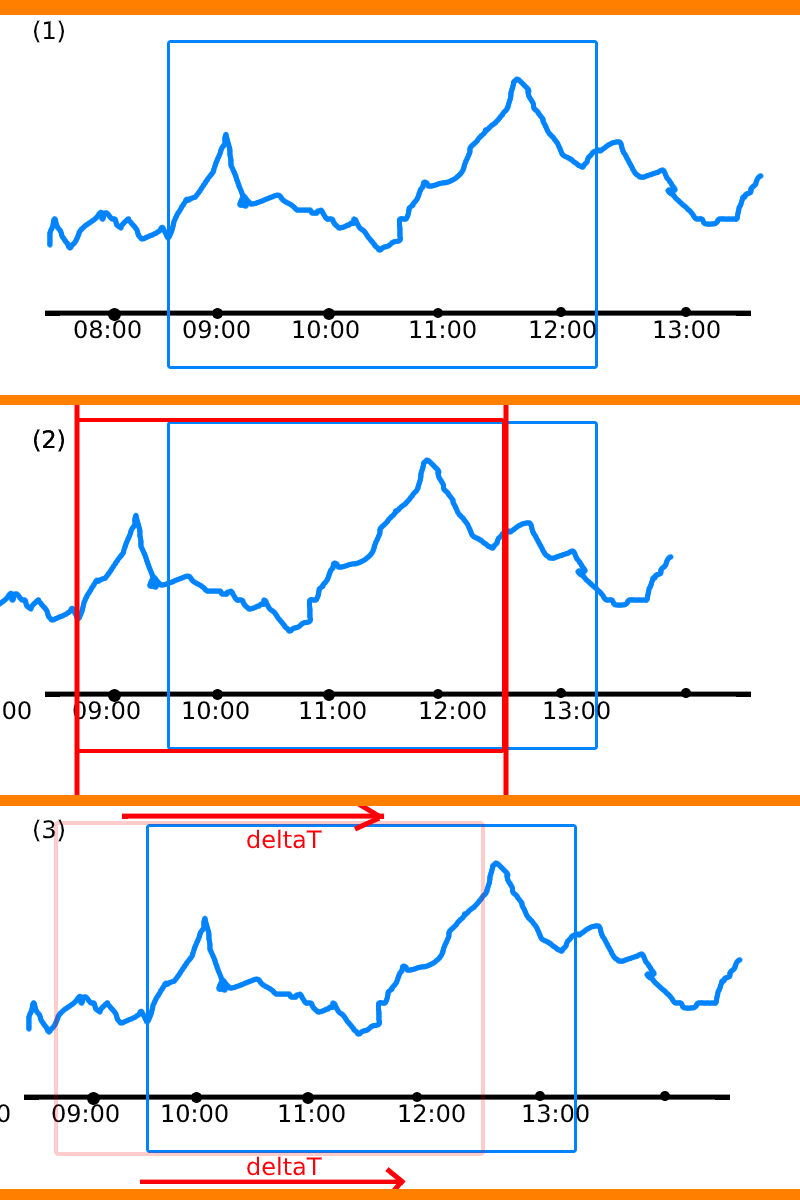
On time zone change, calculate the time-delta and use that to offset the chart so the viewed are remains same.
Here is a diagram of the process (sorry for the poor drawings).
This works, but what I have noticed is that, I first have to apply the shifted position, by setting the .start and .end properties. Once those are set, I can only apply the corrective time delta then and shift the viewing window back into it’s relative space. This creates a bit of jump and is not looking very elegant. Please see the *.gif file below:
I would avoid changing the data and start and end properties of the range completely. Instead, I would probably just create a custom ticker that can offset the displayed data by the given amount.
Oh, I see. Completely rebuilding the dataframe’s date-time column with the shifted time? But isn’t that still going to result with a shifted viewing range?
Let’s say the first index, index [0] is 21:30 (UTC+01:00) and this is the very left start point of the chart.
Once we switch to (UTC+03:00), index [0] now becomes 23:30 and the chart shifts , there is something else at the position of 21:30… we still need to compensate and re-frame so that index [0] is once again at the very left start point… and the time is 23:30.
In case there is a solution, the aim is to prevent a shift and loss of viewed area once the time-zone is changed.
No, that’s the opposite. As I said - avoid changing the data.
I now realize that apart from a custom ticker you’d also need a custom formatter that also applies the same offset. And a custom hover if you use the hover tool to display the timestamp.
And if you work only with 1-hour-based timezones (i.e. no half-hour or 45-minute timezones and the like), then you don’t need a custom ticker since all hours will still land on hours and not on 30-minute intervals or something like that.
So e.g. if you need to apply UTC+1 timezone to the data in the UTC timezone, you’d set the formatter to format the labels with an additional hour in mind, so 11:00 becomes 12:00, but only on the axis.
Alternatively, you can use a CustomJSTransform along with transform (some explanation is available here https://docs.bokeh.org/en/latest/docs/user_guide/data.html#transforming-data and there may be other places in the documentation - I didn’t search very thoroughly). It may require some fiddling like manually calling source.change.emit() each time you change the offset, and I think it requires manually changing the start and end values of the X range.
Could you please help me in regards to the custom DateTimeFormatter and a custom HoverTool. What would be the proper API to link pre-processor functions (is that even possible?) that would be capable of modifying the contents of the x_axis and the hover data displayed?
I really would love to explore this concept, but there is also a simpler solution, very basic but might work. As I’m running out of time, I got a button called Recenter working. Basically this will require the user to click it and this will reframe the previously viewed region after a time-zone change. It’s not ideal. but might avoid the jump in the chart, at least might make a re-framing operation more expectable.
Probably a temp solution until I find how to write my own Formatters.
Also, I just realised, that I have a data-table at the bottom. The data table has to show the correct time. This might required adding another layer of pre-processors and formatters. I think this will get out of control too quick when it comes to keeping the underlying data constant and augmenting it through formatters.
But for future reference, don’t you think it is too much of an overhead trying to not alter the data, but instead augment all the UI/UX components just to provide a pivoting and fixed frame of view? Do you think this should be a feature request or something?
Considering the fact that there are other components and other widgets that may be involved such as data-tables etc. none of the approaches we have discussed so far provide an efficient solution to this issue. I mean, you will need a formatter for the data-table, for the main chart, for the hover tool etc.
To me, it just looks like a massive hack, instead of being able to shift the frame of view before things are rendered?
Anyway, I’m still open to suggestions and curious to hear if a more efficient solution might be available
Right now - not really, no. You’re the first person that I see that needs such kind of functionality. And it’s not like it’s not possible, it just requires careful and time consuming orchestration of the existing Bokeh models.
A more generic and useful feature would be to make it possible to provide transforms to every reasonable Bokeh model. Hover tools, data table columns, maybe even axes. Likely there are other models that I missed. For this, I think, a feature request would make sense.
I’m still getting a blank canvas in cases where the shift is too violent. For example, in cases where I only have 24h of data and the change is from UTC-10:00 to UTC+13:00.
The re-framing process fixes this, but was just curious if there is a way to fix that.
I guess this also highlights the importance of being able to re-frame, especially if you are observing a section of your time-series data and you need to switch to a different time-zone (for some reason), ideally you would not want to loose your area of examination.
Yes, the button deals with the jump, but it is an extra step. I obviously prefer the automatic start and end update.
Anyways, having reviewed my code now, for the purpose of this question, I have realized there are couple of obsolete steps that I was taking. Those were unnecessary. Now the automatic reset is a bit less jumpy and I think this might work.
But the jump is caused due to the fact that when we issue the following:
source.data = new_data
(And new_data here is any kind of a manipulation, including the time-zone shift in the dataframe.)
So once the source is updated, the plot re-renders.
Then when we do the following:
a = p1.x_range.start + timedelta
b = p1.x_range.end + timedelta
p1.x_range.update(start=a, end=b)
This causes a seconda re-draw. This is the reason behind the jump.
The solution I guess would be to delay the plot update after the data update, change the end and start ranges in the background and then issue the draw call.
Something like this:
# The "draw on source update" is paused.
p1.setDrawMode(delayed=True)

# The plot does not update here.
source.data = new_data

# We do our corrective stages on the canvas.
a = p1.x_range.start + timedelta
b = p1.x_range.end + timedelta
p1.x_range.update(start=a, end=b)

# Now we can draw the plot.
p1.applyDraw()

# The "draw on source update" is re-enabled.
p1.setDrawMode(delayed=False)
Yeah, right now there’s no way to group multiple events into a single patch message. I’ve started implementing it locally but I have no idea when (and whether) it will end up in the main codebase.
To alleviate the jumping, you can try hiding every renderer by setting visible=False, then do all the things that change the plot, and then finally set visible=True. I do something like this in some of my own plots, with an additional “Rendering…” label because there are some computations that can time quite some time.
Ah, this is not an issue at all, don’t worry about it.
It’s just a regular field that you can change like any other:
circle_renderer = p.circle(...)

def update():
    circle_renderer.visible = False
    def do_update():
        # This function is needed to make sure that the above change
        # is delivered to the document right away, without stalling.
        ... # Do some computations, change ranges, etc.
        # If you do some extensive computations here, you may want to use threads:
        # https://docs.bokeh.org/en/latest/docs/user_guide/server.html#updating-from-threads
        circle_renderer.visible = True

    curdoc().add_next_tick_callback(do_update)

b = Button()
b.on_click(update)
I can’t share the exact code because it’s not open-source, but for my case I created a custom model that would draw a text overlay on top of the whole plot. The only reason I decided to create a custom model is to avoid having to position it every time in the very center of the plot. But you can just use a regular Label. Then, just trigger its visible property similar to how it’s done in the example above.
Thank you very much. This is really a great help already. I will have a look at these and hopefully will come up with a solution. Definitely, this was a good learning experience.
One final question. Does Bokeh support animations? Maybe it would be possible to tween (easy-in, easy-out) between two different start-end ranges? Usually through a cubic interpolation etc.