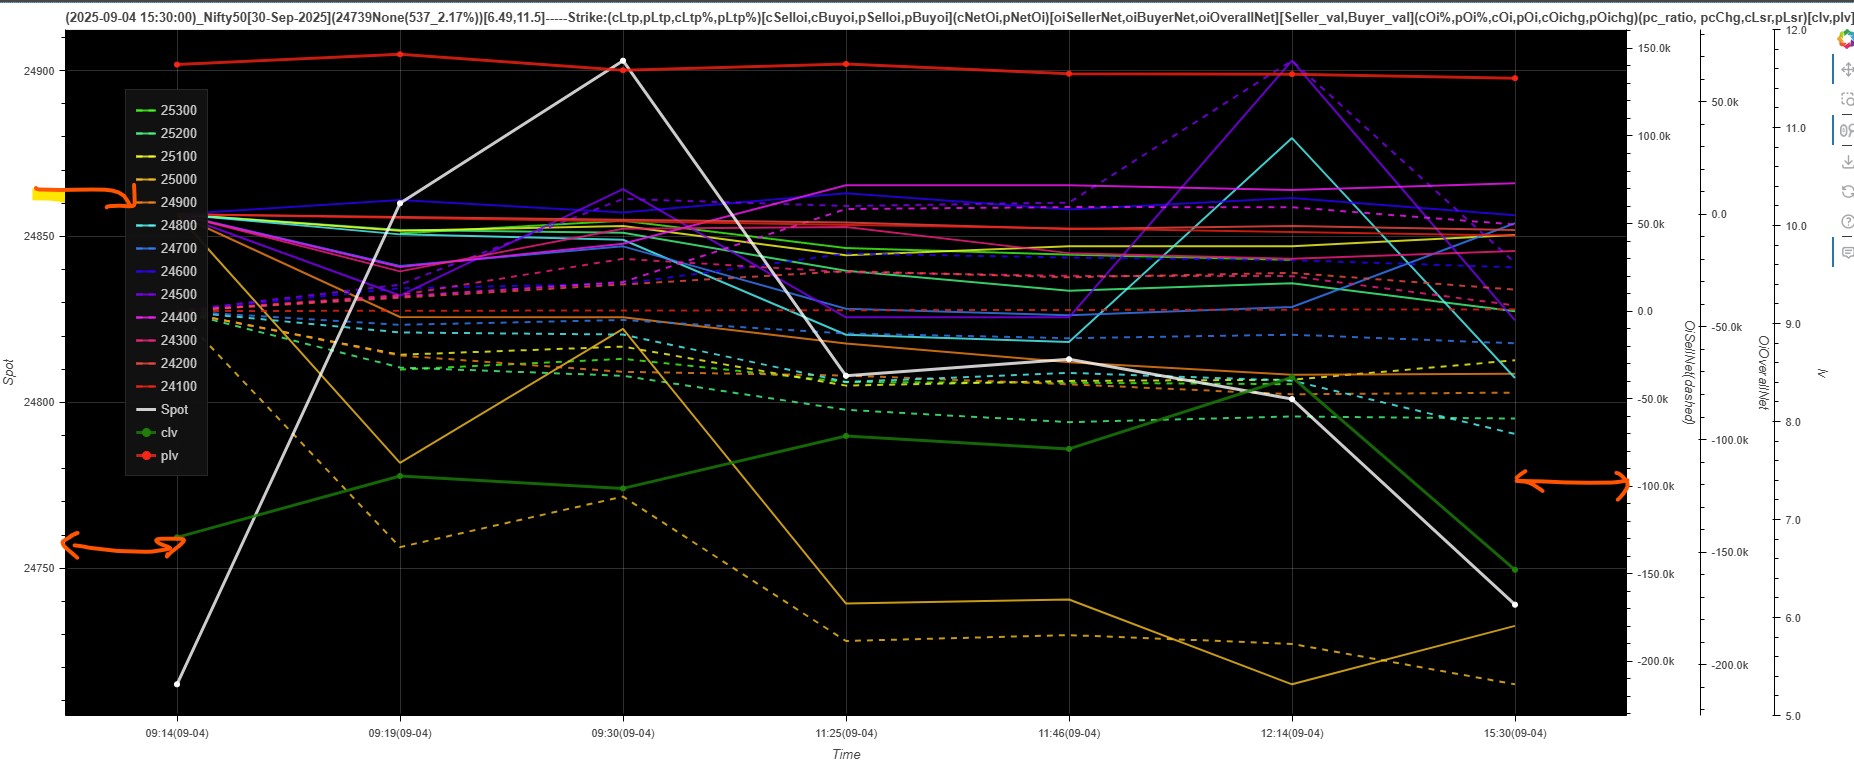
Charts(Categorical - x axis) still show padding /margin after setting them to 0, resulting in overlapping of legend and a constrained view . Any additonal setting to stretch chart to max width ?
Settting -
        plot.legend.margin = 60
        plot.min_border_left = 0  # Accommodate Legend and strech chart to max width
        plot.min_border_right= 0
The padding here comes from the fact that it is a categorical range. Categorical axes always render the categorical factors equally spread out with some space around both sides. This is because categorical ranges are typically used for things like bar charts, and you would never want a bar cut in half at the edge of the chart.
I’d also mention that although it is technically possible to draw line glyphs on a categorical range, it is almost never a reasonable thing to do. Categorical factors are arbitrary and discrete with no implicit order. There is no “in-between” between factors, so the slopes of lines drawn between them are meaningless.
My actual suggestion here is to use real datetime values on a non-categorical range. Then you can simply set x_range.start and x_range.end to whatever you need (or alternatively, if using default auto-ranges, set x_range.range_padding = 0).
However, using real datetimes will cause the points to be separated by a distance proportional to the actual span of time between the dates, and Bokeh is also free to choose the tick locations for the current scale. If that’s not what you want, then your best bet is probably to “fake” a categorical axis look by using integers for all the x-axis data values, then using a CustomJSTickFormatter (or maybe simpler major_label_overrides config on the axis) to render the integer tick locations with the custom tick labels you want. Then you can set x_range.start = 0 and x_range.end = 7 (or whatever N is appropriate for how many points you have).