The problem I’m having may be self-inflicted, but we shall see. I’m running this code as a server and it renders just fine, but when I adjust the slider to fill (vertical increase) and then change the slider to reduce the bar (vertical decrease) I’m left with what looks like a ghosting effect or tracers as some may call it. I’ve looked around for documentation on how to overcome this and found nothing so far. Its either the way I’m drawing or I’m missing a parameter is my thoughts.
I’m unable to share the full code, but here are some key snippets. threshSelect = Slider(title='Thresh', value=thresh, start=1, end=100, step=1)
threshSelect.on_change('value', updateThresh)
This is called in the initial plot and also in the callback “updateThresh”: barchart.vbar(x='Category', top='Count', width=0.9, source=source, line_color='white', fill_color=factor_cmap('Category', palette=Spectral6, factors=cats))
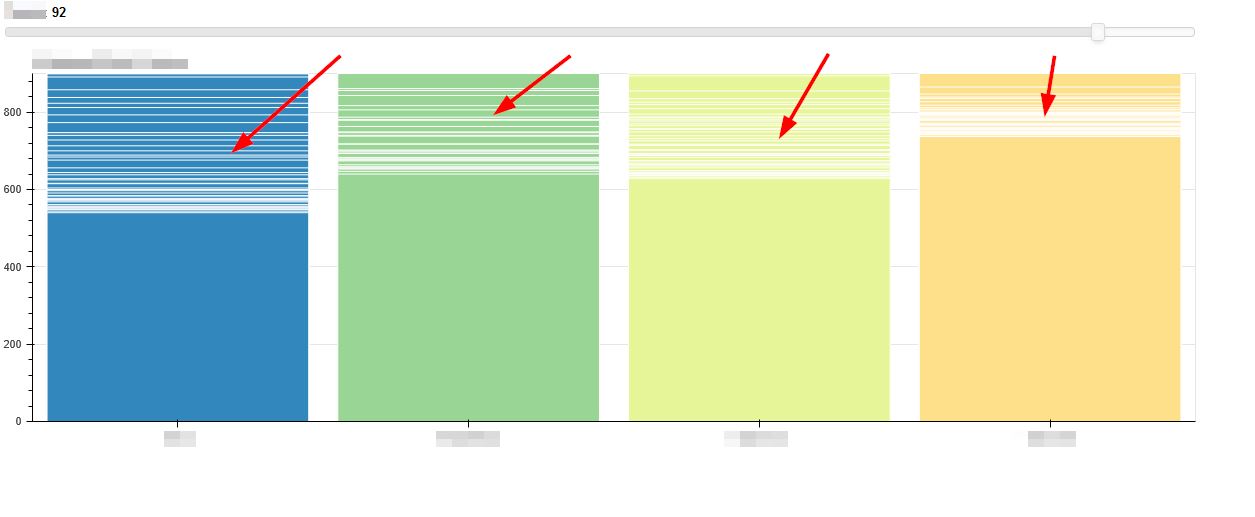
This is what I see when scaling up then down on the Slider:
The question is a bit vague. If I understand what you are referring to, that looks like the white border (which will always be drawn, regardless of width, even zero width). Perhaps you want line_color to be None (to not draw at all) or the same color mapper as the fill.
Thanks for the suggestion. I tried None and also just setting as the same color as the fill. The behavior then was to vertically grow with color, but then never indicate decrease. I don’t get the ghosting behavior this way, but the graph is a one-way trip with this setting.
Is there something I missed when redrawing to set the background color to overwrite on refresh? Perhaps a setting that doesn’t belong to vbar itself.
I thought I had to clean this up a lot more before making it public, but it wasn’t as difficult as I had previously believed. This should work as an MRE
@Sn3akyP3t3 the problem is you are adding a completely new glyph by calling vbar every time the callback is called. That is additive (the previous glyphs don’t go away). Typical usage with Bokeh would only call the plotting functions once, then only update the data source for that glyph in callbacks in order to change the existing glyph. The sliders.py demo in the repo is a canonical, prototypical example you can emulate:
So it seems the resolution was quite simply to use this in the update callback routine source.data = localDf
I had looked at other examples online and found some were using this source.stream(source.data)
which didn’t produce any noticeable results so I went with what I knew changed the data resulting in the confusion that led me there. Thanks for the help @Bryan!
source.stream is for streaming new, additional points to the end of existing data (e.g a continuously updating time-series) it’s not suitable for when you want to replace all the old data on updates (in that case, just assign a new .data value)