I’m wondering if it’s possible to render a figure without there being any data in it. The use case is that I want to show the user an empty plot which they are then able to fill with data of their own.
With the following code (modified from the code given at Providing data — Bokeh 2.4.2 Documentation):
from bokeh.plotting import figure, show
from bokeh.models import ColumnDataSource

# create a Python dict as the basis of your ColumnDataSource
data = {'x_values': [],
        'y_values': []}

# create a ColumnDataSource by passing the dict
source = ColumnDataSource(data=data)

# create a plot using the ColumnDataSource's two columns
p = figure()
p.circle(x='x_values', y='y_values', source=source)
show(p)
I get this output:

I’d like the axes/grid to be rendered so the user knows that that blank space is a graph. Basically, I want it to look like what one gets the unmodified code given at Providing data — Bokeh 2.4.2 Documentation
from bokeh.plotting import figure, show
from bokeh.models import ColumnDataSource

# create a Python dict as the basis of your ColumnDataSource
data = {'x_values': [1, 2, 3, 4, 5],
        'y_values': [6, 7, 2, 3, 6]}

# create a ColumnDataSource by passing the dict
source = ColumnDataSource(data=data)

# create a plot using the ColumnDataSource's two columns
p = figure()
p.circle(x='x_values', y='y_values', source=source)
show(p)
Which gives
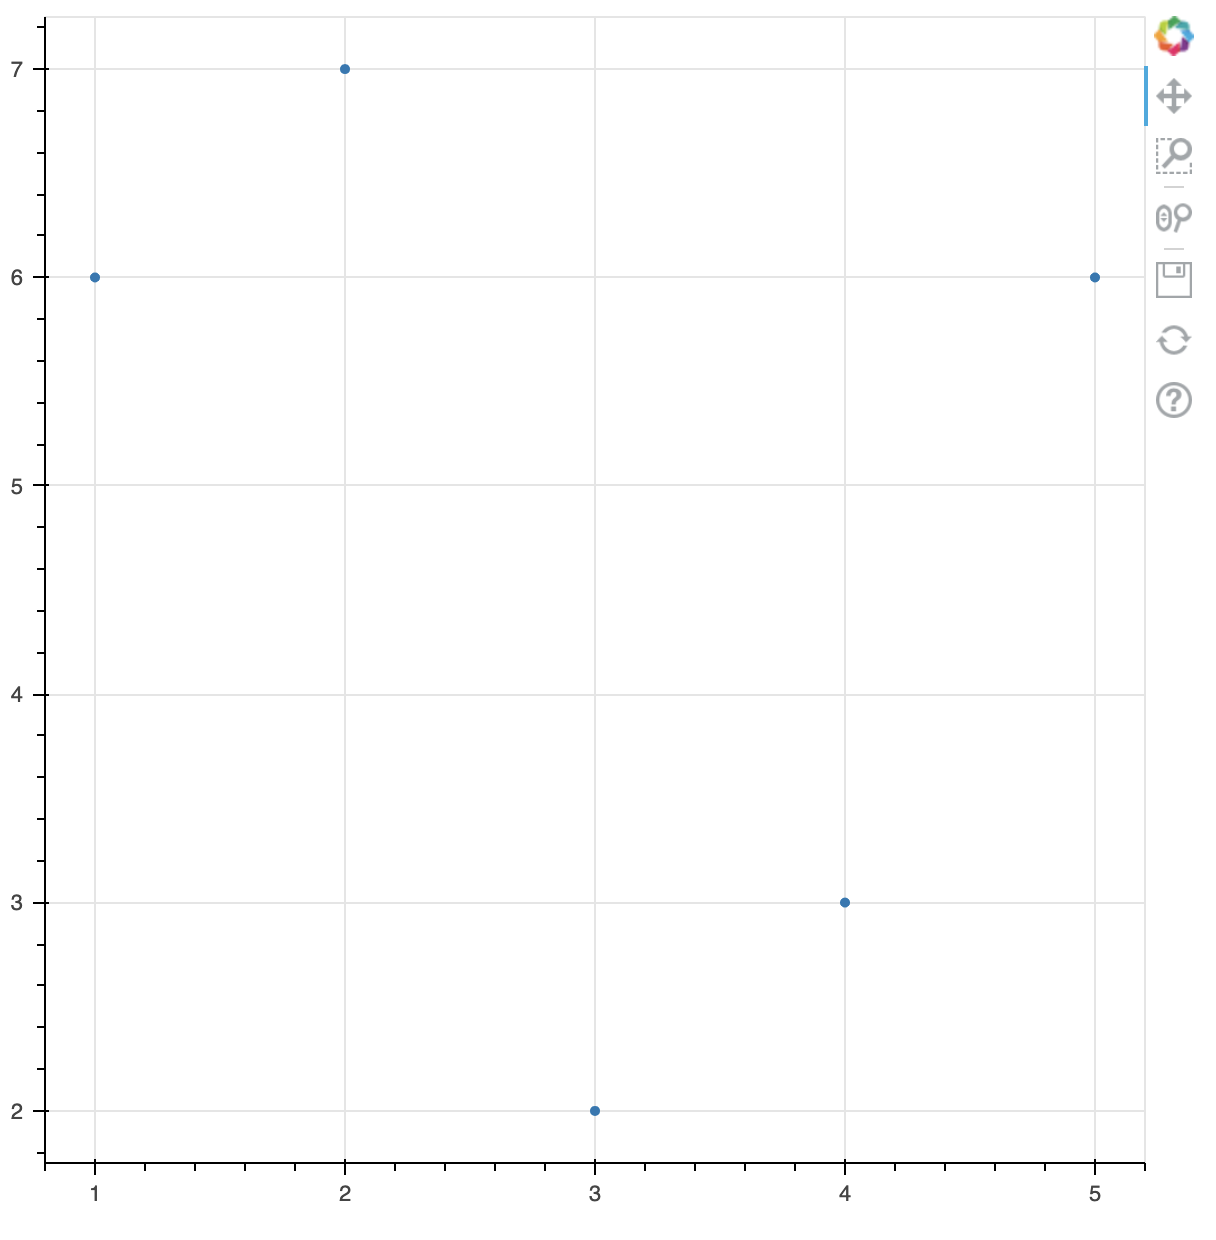
I just want the scatter points to not be shown.
If I add in a line with only one data point, e.g.:
from bokeh.plotting import figure, show
from bokeh.models import ColumnDataSource

# create a Python dict as the basis of your ColumnDataSource
data = {'x_values': [],
        'y_values': []}

# create a ColumnDataSource by passing the dict
source = ColumnDataSource(data=data)

# create a plot using the ColumnDataSource's two columns
p = figure()
p.line(x=[0], y=[0])
p.circle(x='x_values', y='y_values', source=source)
show(p)
This gets me:
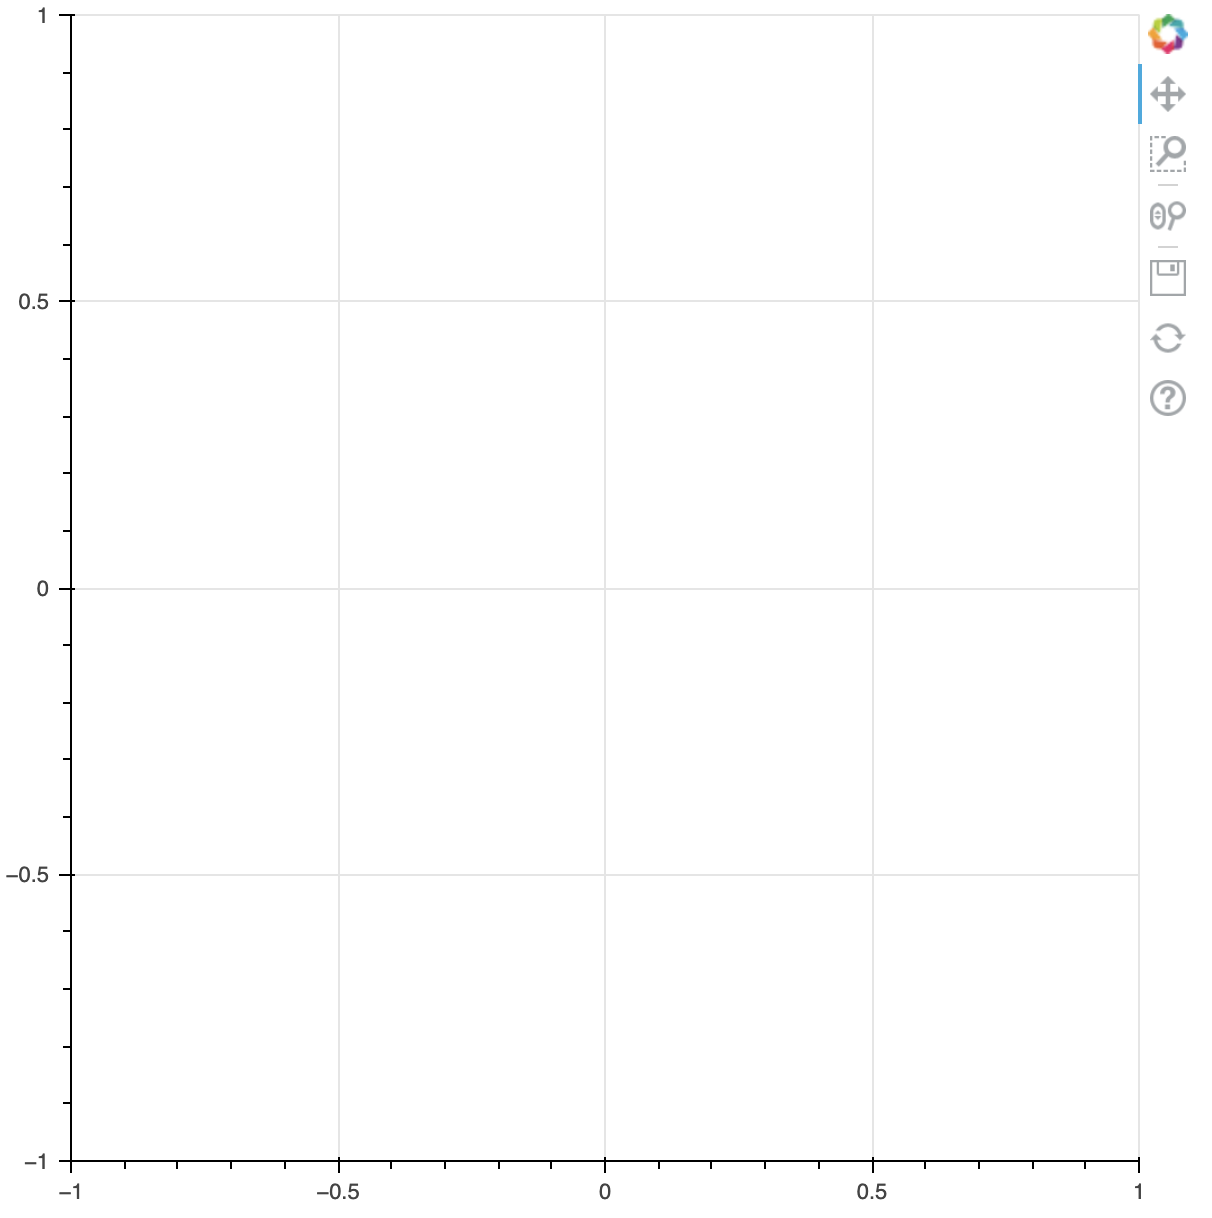
which is what I want. However, then I need to delete the fake line when the user loads their own data, which is very inelegant.
Is there any more elegant way to do this?