Rendering non-selected glyphs below selected glyphs

Hi I have a plot with a few MultiLine glyphs, each plotting many lines (100s).
When selecting a line, the non-selected glyphs from other MultiLine glyphs will overlap. Is there a way to change this? I can of cause turn the alpha of the non-selected glyph down to make the effect less visible, but I would prefer to render all non-selected glyphs below any selected glyph.

I tried setting ‘layer’ for the non-selected glyph, but that option is not available there.

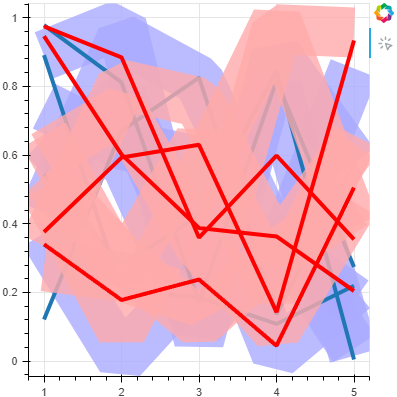
Here is an example that illustrates the problem; exaggerated by using a very wide line for the non-selected glyph:

bokeh_render_order

from bokeh.plotting import figure, show, output_notebook
from bokeh.models import ColumnDataSource
import numpy

# Prepare some data
numpy.random.seed(100)
N=10
data = {
    'x_values': [[1, 2, 3, 4, 5] for i in range(N)],
    'y_values': [numpy.random.rand(5) for i in range(N)],
    'y2_values': [numpy.random.rand(5) for i in range(N)],
}
source = ColumnDataSource(data)

# Create a new plot with two glyphs, blue and red lines.
p = figure(width=400, height=400, tools='tap')

# Plot blue lines first, they will be rendered on the bottom
l_blue = p.multi_line(xs='x_values', ys='y_values',  line_width=4, source=source)
l_blue.nonselection_glyph.line_color = '#aaaaff'
l_blue.nonselection_glyph.line_alpha = 0.8
# Exaggerate line width to make the effect more visible
l_blue.nonselection_glyph.line_width = 50

# Plot red lines second, they will be rendered on top
l_red = p.multi_line(xs='x_values', ys='y2_values',  line_width=4, source=source ,line_color='red')
l_red.nonselection_glyph.line_color = '#ffaaaa'
l_red.nonselection_glyph.line_alpha = 0.8
# Exaggerate line width to make the effect more visible
l_red.nonselection_glyph.line_width = 50

# Select a few lines
source.selected.indices = [0,1,2,3]

# Show the plot
# Note that selected lines are rendered above on-selected lines but only within the group of 'l_red' and 'l_blue'.
# All red lines are rendered above blue lines, both selected and unselected.
show(p)

I don’t know why I didn’t think of this sooner; I can plot each MultiLine twice, making the selected glyph invisible on one and the non-selected invisible on the other.

It gives the correct output, but feels a bit hacky:

image

from bokeh.plotting import figure, show, output_notebook
from bokeh.models import ColumnDataSource
import numpy

# Prepare some data
numpy.random.seed(100)
N=10
data = {
    'x_values': [[1, 2, 3, 4, 5] for i in range(N)],
    'y_values': [numpy.random.rand(5) for i in range(N)],
    'y2_values': [numpy.random.rand(5) for i in range(N)],
}
source = ColumnDataSource(data)

# Create a new plot with two glyphs, blue and red lines.
p = figure(width=400, height=400, tools='tap')

# Plot blue lines first, they will be rendered on the bottom
l_blue = p.multi_line(xs='x_values', ys='y_values',  line_width=4, source=source, line_color='blue', line_alpha = 0, legend_label='blue')
l_blue.nonselection_glyph.line_color = '#aaaaff'
l_blue.nonselection_glyph.line_alpha = 0.8
# Exaggerate line width to make the effect more visible
l_blue.nonselection_glyph.line_width = 50

# Plot red lines second, they will be rendered on top
l_red = p.multi_line(xs='x_values', ys='y2_values',  line_width=4, source=source , line_color='red', line_alpha = 0, legend_label='red')
l_red.nonselection_glyph.line_color = '#ffaaaa'
l_red.nonselection_glyph.line_alpha = 0.8
# Exaggerate line width to make the effect more visible
l_red.nonselection_glyph.line_width = 50

# Plot blue lines first, they will be rendered on the bottom
l_blue = p.multi_line(xs='x_values', ys='y_values',  line_width=4, source=source, line_color='blue', legend_label='blue')
# Only render selected glyphs
l_blue.nonselection_glyph.line_alpha = 0

# Plot red lines second, they will be rendered on top
l_red = p.multi_line(xs='x_values', ys='y2_values',  line_width=4, source=source ,line_color='red', legend_label='red')
# Only render selected glyphs
l_red.nonselection_glyph.line_alpha = 0

# legends can only be made interactive after plotting something
p.legend.click_policy="hide"

# Select a few lines
source.selected.indices = [0,1,2,3]

# Show the plot
# This correctly renders selected glyphs on top, but it feels a bit hacky
show(p)

Is there a more “correct” way perhaps?

For a given glyph the non-selected part always renders before the selected part. But amongst multiple glyphs, each glyph (all of the it, selected and non-selected parts) are rendered in the order the glyphs are specified in the figures renderers list. There is no way to make all non-selected of different glyphs render before all selected of those glyphs.

II can’t think of any great workaround off the top of my head, so if you have found a solution, it’s probably reasonable.

Thanks for the swift reply :smiley:

It’s a bit unfortunate, but at least there is a work-around.