Hello again,
I was wondering if it is possible to position axis within a plot area? I would like to create a target diagram, like this one, http://www.ifremer.fr/vacumm/_images/misc-plot-basic-target.png
It would be good if I could also lock the the origin to the centre of the plot when plotting data with different ranges.
Thanks,
Rob
See the answer here. https://discourse.bokeh.org/t/use-axis-in-a-conventional-way/5776/3
The solution specifies the axes origin in units of the data, not via enumerations like middle and center. The consequence being if you want it to be centered as plot ranges change, you’d probably have to make changes in a callback when the ranges change.
Thanks, I hadn’t found that solution, I think it should work for me.
I have a couple of follow up questions,
-
Is using plot.x_range.setv the method I should use of updating x_range? in reality I will have many plots to update and my code is already getting a bit long.
-
If I want to add some text to replace the missing axis labels is there a particular way I should approach this?
Question 1:
If plot is a bokeh Figure, I am not familiar with the setv() method for x_range, which is DataRange1d quantity. Something like the following works to manually set the range.
plot.x_range.start = -5.0
plot.x_range.end = 5.0
Question 2
I think you’re referring to the fact that choosing text for the axis label is not visible if you use the fixed location property. Correct? I suppose it might be worth raising an issue with the development team or asking if this is intended behavior for some reason.
In the interim, as a workaround, you can probably add annotations to position axis labels wherever you want. If you only need to do one at a time, see the Label method. If you have to do many at once, LabelSet is more efficient. See the Labels section of the documentation here, which includes some examples of their use. https://docs.bokeh.org/en/latest/docs/user_guide/annotations.html
-
Thanks, yes in this example plot would be a figure, sorry I should have made this clear. The values of the range start and end are being calculated in my CustomJS code. Initially I tried manually setting the range as you suggest but couldn’t find a way to have this update from my callback.
-
Yes that’s right. I haven’t experimented with labels yet so I’m not sure if they can be used outside of the plot area. Axis labels aren’t crucial for now, so I’ll just use the plot title to define x and y. I’m sure enabling axis labels AND fixed axis is on someones ‘to do’ list, but I’m guesing it’s not a common problem.
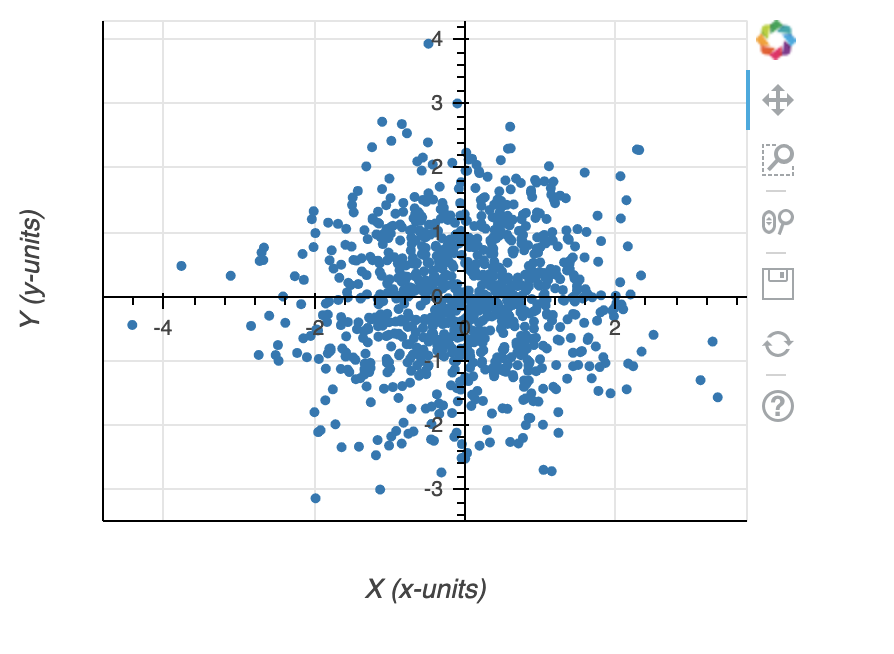
I see. If you want your axes centered in the plot but labels in customary locations like x-axis below and y-axis to the left, the following solution might work for you. I’ve just added extra axes and hidden certain properties using the transparency (alpha) settings; there are other ways by changing colors, but hopefully this gives a starting point for something useful.
#!/usr/bin/env python3
# -*- coding: utf-8 -*-
"""
"""
import numpy as np

from bokeh.plotting import figure, show
from bokeh.models import ColumnDataSource, Range1d, LinearAxis

x = np.random.randn(1001)
y = np.random.randn(1001)

data = dict(x=x, y=y)
source = ColumnDataSource(data=data)


p = figure(width=400, height=300)
r = p.circle(x='x', y='y', source=source)

p.xaxis.fixed_location = 0.0
p.yaxis.fixed_location = 0.0

llx = p.extra_x_ranges['llx'] = Range1d()
lly = p.extra_y_ranges['lly'] = Range1d()

aax = LinearAxis(x_range_name='llx', axis_label='X (x-units)')
aay = LinearAxis(y_range_name='lly', axis_label='Y (y-units)')

aax.major_label_text_alpha = 0.0
aax.major_tick_line_alpha = 0.0
aax.minor_tick_line_alpha = 0.0

aay.major_label_text_alpha = 0.0
aay.major_tick_line_alpha = 0.0
aay.minor_tick_line_alpha = 0.0

p.add_layout(aax, 'below')
p.add_layout(aay, 'left')

show(p)
1 Like
Fantastic! I’m sure this will work for my case.