Hello, I have a similar problem to this, where my output from a bokeh program shows all the graphs that I have ever produced using this code, appending the newest one at the very bottom. I’m using bokeh with anaconda and sublime, and running it in terminal. I’ve attached the .py file.
I’m trying to figure out how to edit the button feature effectively. I’m interested in doing something like the stock ticker example (which I haven’t been able to get working since I’m not in an iPython notebook). I have my own candlestick plots that I want to toggle between. Figuring out how these buttons work is the first step.
I can confirm this behavior with the current master, it would be helpful if you could add any additional information about what versions you have or have not had this problem with on that issue.
Thanks,
Bryan
···
On Mar 10, 2015, at 11:20 PM, Kevin Crispie <[email protected]> wrote:
Hello, I have a similar problem to this, where my output from a bokeh program shows all the graphs that I have ever produced using this code, appending the newest one at the very bottom. I'm using bokeh with anaconda and sublime, and running it in terminal. I've attached the .py file.
I'm trying to figure out how to edit the button feature effectively. I'm interested in doing something like the stock ticker example (which I haven't been able to get working since I'm not in an iPython notebook). I have my own candlestick plots that I want to toggle between. Figuring out how these buttons work is the first step.
On Wednesday, 11 March 2015 00:23:32 UTC-4, Kevin Crispie wrote:
Hello, I have a similar problem to this, where my output from a bokeh program shows all the graphs that I have ever produced using this code, appending the newest one at the very bottom. I’m using bokeh with anaconda and sublime, and running it in terminal. I’ve attached the .py file.
I’m trying to figure out how to edit the button feature effectively. I’m interested in doing something like the stock ticker example (which I haven’t been able to get working since I’m not in an iPython notebook). I have my own candlestick plots that I want to toggle between. Figuring out how these buttons work is the first step.
Build /(Ctrl +B) your code in sublime. When you are done with that chart - close the tab.
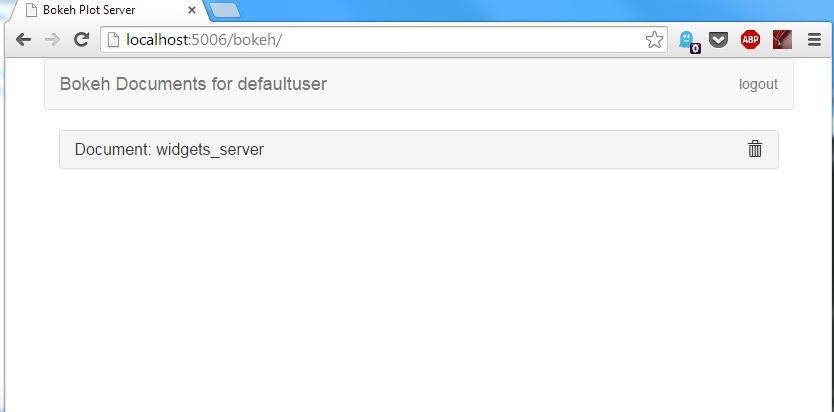
Switch to the first tab and click the trash can icon on the RHS.
Edit code and rebuild
Hopefully that will only have one chart visible.
Kind regards
KK
On Wednesday, 11 March 2015 00:23:32 UTC-4, Kevin Crispie wrote:
Hello, I have a similar problem to this, where my output from a bokeh program shows all the graphs that I have ever produced using this code, appending the newest one at the very bottom. I’m using bokeh with anaconda and sublime, and running it in terminal. I’ve attached the .py file.
I’m trying to figure out how to edit the button feature effectively. I’m interested in doing something like the stock ticker example (which I haven’t been able to get working since I’m not in an iPython notebook). I have my own candlestick plots that I want to toggle between. Figuring out how these buttons work is the first step.
Thank you,
Kevin Crispie
–
You received this message because you are subscribed to the Google Groups “Bokeh Discussion - Public” group.
To unsubscribe from this group and stop receiving emails from it, send an email to [email protected].
Build /(Ctrl +B) your code in sublime. When you are done with that chart - close the tab.
Switch to the first tab and click the trash can icon on the RHS.
Edit code and rebuild
Hopefully that will only have one chart visible.
Kind regards
KK
On Wednesday, 11 March 2015 00:23:32 UTC-4, Kevin Crispie wrote:
Hello, I have a similar problem to this, where my output from a bokeh program shows all the graphs that I have ever produced using this code, appending the newest one at the very bottom. I’m using bokeh with anaconda and sublime, and running it in terminal. I’ve attached the .py file.
I’m trying to figure out how to edit the button feature effectively. I’m interested in doing something like the stock ticker example (which I haven’t been able to get working since I’m not in an iPython notebook). I have my own candlestick plots that I want to toggle between. Figuring out how these buttons work is the first step.
Thank you,
Kevin Crispie
–
You received this message because you are subscribed to the Google Groups “Bokeh Discussion - Public” group.
To unsubscribe from this group and stop receiving emails from it, send an email to [email protected].