I am trying to render a web page with bokeh chart generated based on user input parameters. However the plot width is hard coded at the moment and I would like it to be dynamic so it can resize and adapt based on User’s screen size. I have tried all the values for sizing_mode from scale both to stretch both in combination with height and width policy and aspect ratio but none of them seem to give me that desired result.
Is there a specific combination that has worked for you. Also if it is not feasible, what is the closest config I could use to get something close to my desired resize capability.
First of all thanks for your quick response. Greatly appreciated.
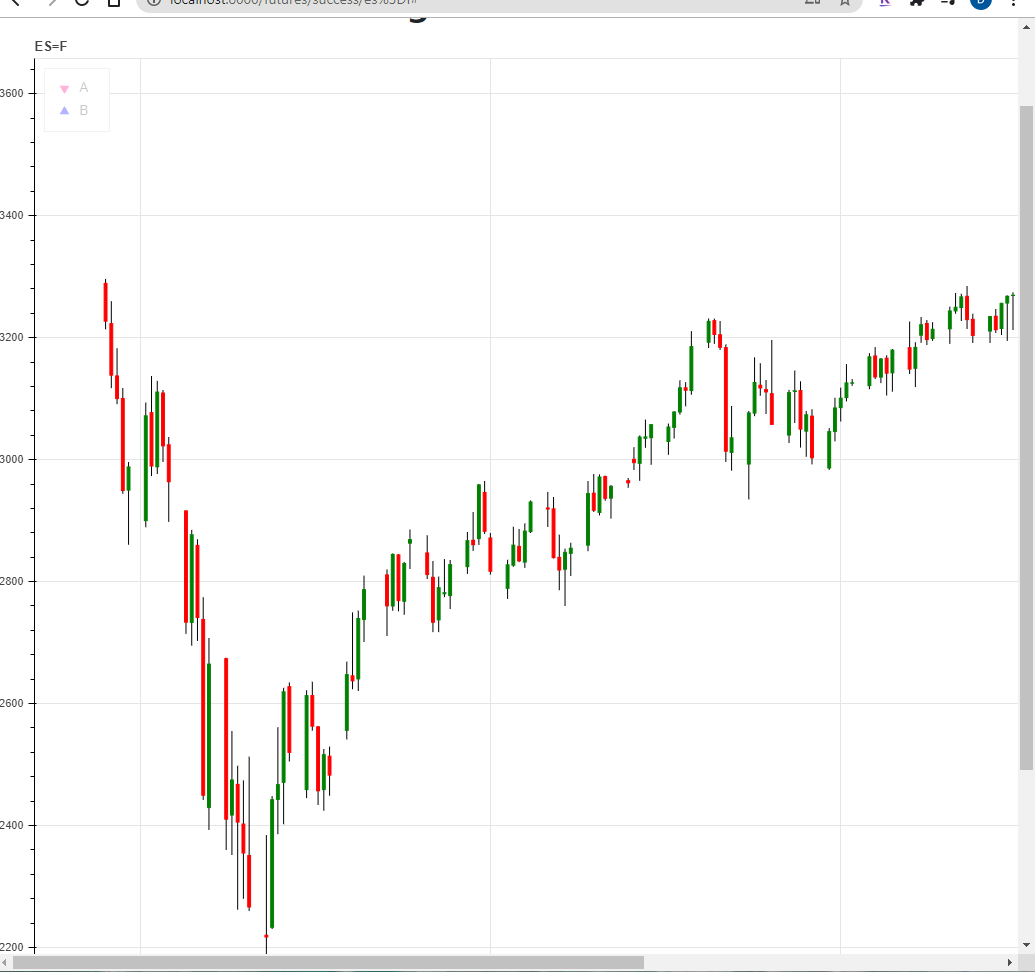
Secondly, I have been trying to config values like given below so that the chart generated could fit into whatever size the browser window is. But as you can see in the attached image, the chart is not fitting into the browser window.
This is what I have at the moment for rendering figure
p = figure(x_axis_type=“datetime”, x_minor_ticks=5, plot_width=1600, plot_height=1000)
I have also tried sizing_mode=‘scale_both’ and height_policy to fit etc but it did not make any difference besides making the chart really tiny which I do not want.
I hope this helps you to suggest what I might be doing worng.
Also please make sure to try with the latest release version 2.2.3. If there is an issue with the latest version then it will have to be investigated and as @p-himik notes, that means providing a complete, minimal, reproducing example.