Hello
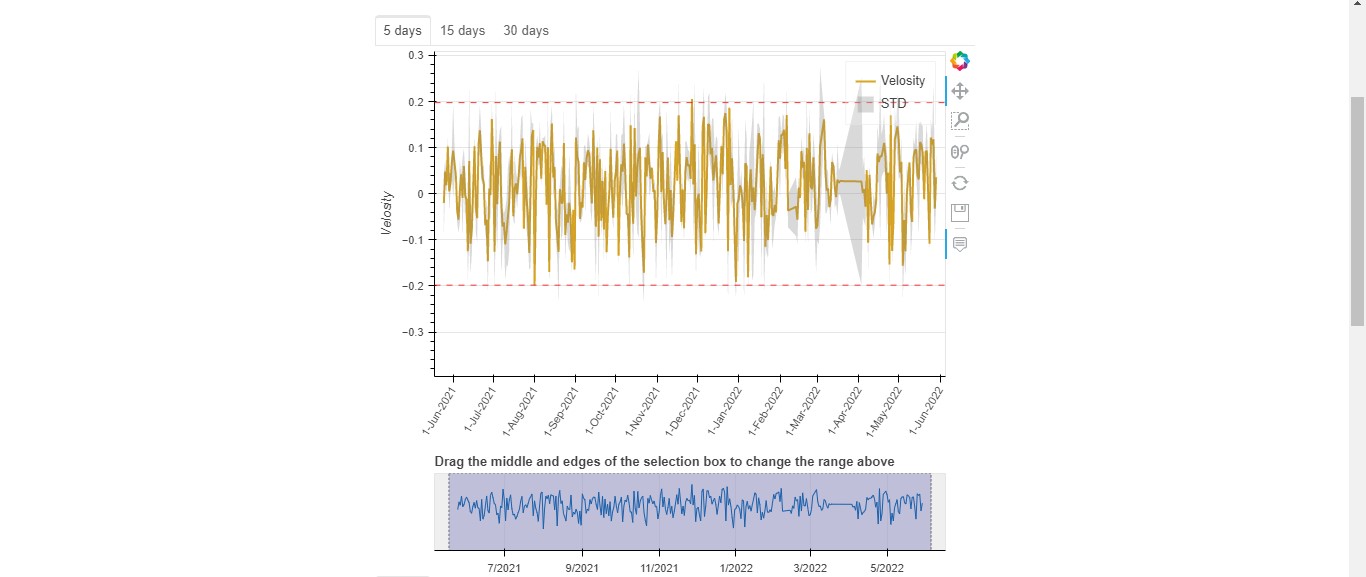
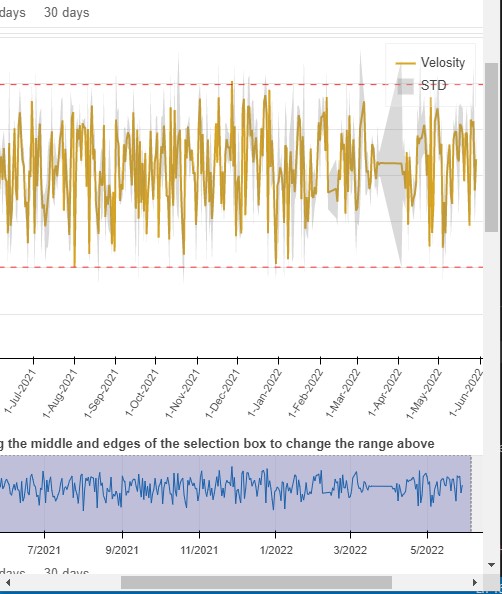
I have several plots on one page but my plots are not responsive. I tested different modes, but I don’t know where the problem is!
In the following, I will write parts of my code.
I couldn’t find the CDN CSS file for bokeh version 2.4 ! Is there no need to add CSS files?
Because the codes are summarized, the output of this code is slightly different from the photos, but the same errors exist.
1- The plot is not responsive.
2- By changing max_width, the size of the plot does not change.
please guide me.
Data:
Data
from bokeh.plotting import figure, show
import pandas as pd
from bokeh.plotting import figure, show
from bokeh.models import ColumnDataSource, ColumnDataSource,ColumnDataSource
from datetime import datetime as dt
from bokeh.layouts import column
from bokeh.plotting import figure,  show
from bokeh.models import ColumnDataSource,Panel, Tabs, ColumnDataSource,ColumnDataSource
from bokeh.layouts import  column

def my_plot(nn):

    dataset = pd.read_csv(r"E:\Project\mysite\web\eshtahard_res_vel.csv")
    dataset = dataset[0:40]
    dataset['Date'] = pd.to_datetime(dataset['Date'])
    Date_list = list(dataset['Date'])
    Date = pd.to_datetime(Date_list, format='%Y-%B-%d')
    velocity = dataset["velocity"]

    source = ColumnDataSource(data=dict(Date=Date, velocity=velocity))


    p = figure(sizing_mode="stretch_width",max_width=1000, height=400)

    p.line(x='Date', y='velocity', source=source,line_color="#DAA520", line_width=2, alpha=1)

    select = figure(title="Drag the middle and edges of the selection box to change the range above", y_range=p.y_range,
			x_axis_type="datetime", y_axis_type=None,tools="", toolbar_location=None, background_fill_color="#efefef",
			sizing_mode="stretch_width",max_width=800, height=130)

    pp= column(p, select)
    return(pp)

# plot res_vel :
p1 = my_plot(1)
tab1 = Panel(child=p1, title="5 days")
p2 = my_plot(2)
tab2 = Panel(child=p2, title="15 days")
p3 = my_plot(3)
tab3 = Panel(child=p3, title="30 days")


Result=Tabs(tabs=[tab1, tab2, tab3])

show(Result)