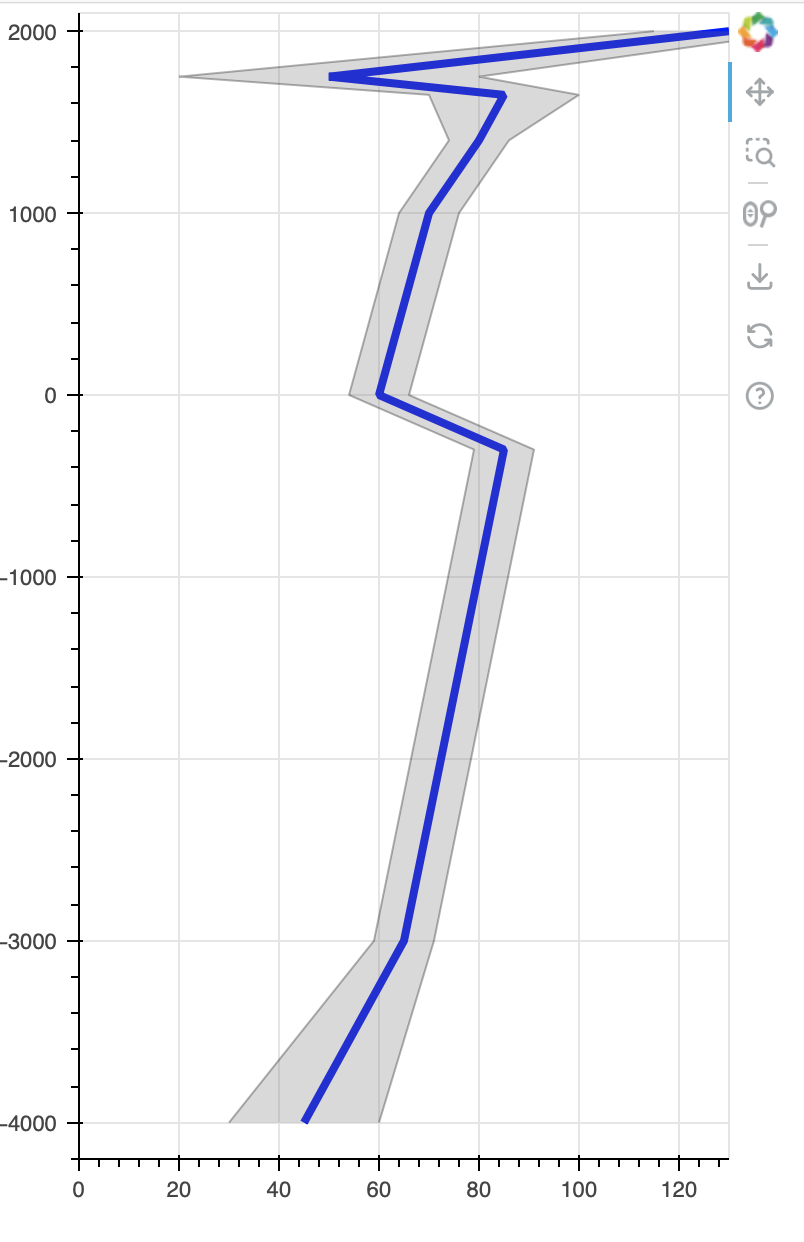
That’s great to hear! Rotating the band is the clean solution I am looking for. Here is a code snippet:
import numpy as np
import pandas as pd
from bokeh.plotting import figure
from bokeh.models import ColumnDataSource, Band
from bokeh.io import show
# Make some simple data
height = np.array([2000.0, 1750.0, 1650.0, 1400.0, 1000.0, 0.0, -300.0, -3000.0, -4000.0])
mean = np.array([130.0, 50., 85.0, 80.0, 70.0, 60.0, 85.0, 65.0, 45.0])
std = np.array([5.0, 10.0, 5.0, 2.0, 2.0, 2.0, 2.0, 2.0, 5.0])
data = pd.DataFrame(np.transpose([height, mean, std]), columns=['Height', 'Mean', 'Std'])
data['Upper'] = data['Mean'] + 3*data['Std']
data['Lower'] = data['Mean'] - 3*data['Std']
# Make a basic bokeh plot
s = figure(plot_width=400, plot_height=600,x_range=[0,130], y_range=[-4200, 2100])
data_source = ColumnDataSource(data)
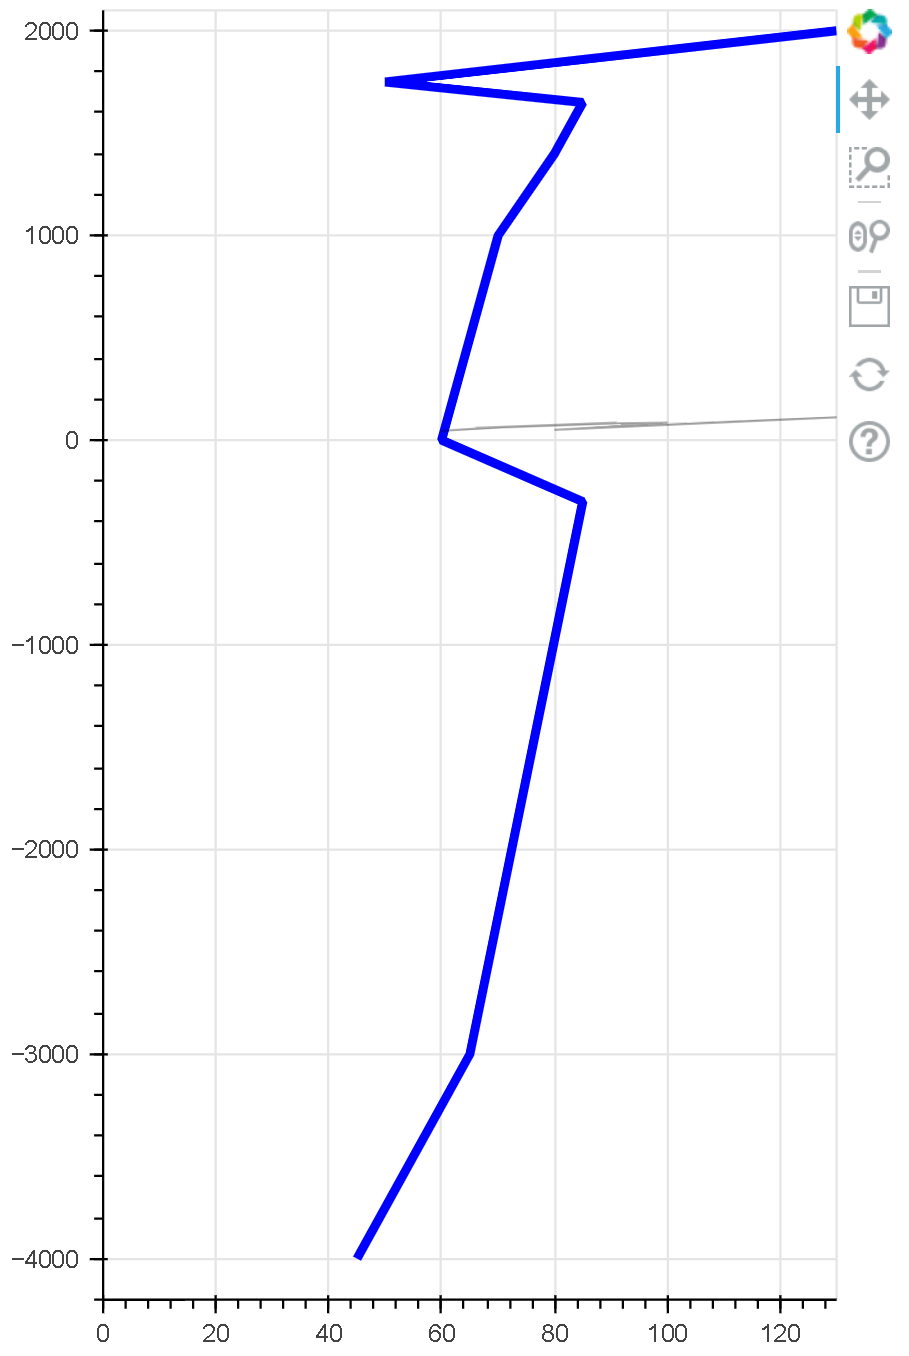
# Create a plot with 'Mean' in X and 'Height' in Y axis. Note that the independent variable is actually 'Height'
plot = s.line(x='Mean', y='Height', line_color='blue', line_alpha=1.0, line_width=4, source=data_source)
# Add a band; the intention here is to create a confidence interval at each 'Height' value. 'Height' is in X axis.
# The band below will not create a plot that I am looking for
band = Band(base="Mean", lower="Lower", upper="Upper", source=data_source, fill_alpha=0.3, fill_color="gray", line_color="black")
s.add_layout(band)
show(s)