For anyone interested here is how one can control the slider from the front end and change the x axis range of the graph to display updated content using an Ajax call.
Here is the views.py code and the resulting javascript code. I removed some pieces that are sensitive. I am passing the plot as a json object as discussed above and I apologise for the bad names and variables I used and I hope people can still understand it.
If there is any way to improve this code to make it better please do post and let me know
Note that the slider i’m using is the ionrange sider and a moment.js library for datetime
https://momentjs.com/
Views.py
#use bokeh to create the layout
ODN_plot_l = layout([hourly_plot], sizing_mode='stretch_width')
#create json item of graphs not the div container where the plot will be embedded is
#called myplot11
json_ODN_plot = json_item(ODN_plot_l,'myplot11' )
#extract the references information this is a huge dictionary
ans = json_ODN_plot['doc']['roots']['references']
#iterate over for loop to extract the start and end times from the columndatasource
#alternatively one can extract it from the XMaxRange and XMinRange but that didn't work.
for item in ans:
#print (item)
if (item['type']=='ColumnDataSource'):
v = item
#save the information
s_start = v['attributes']['data']['date'][0]
s_end = v['attributes']['data']['date'][-1]
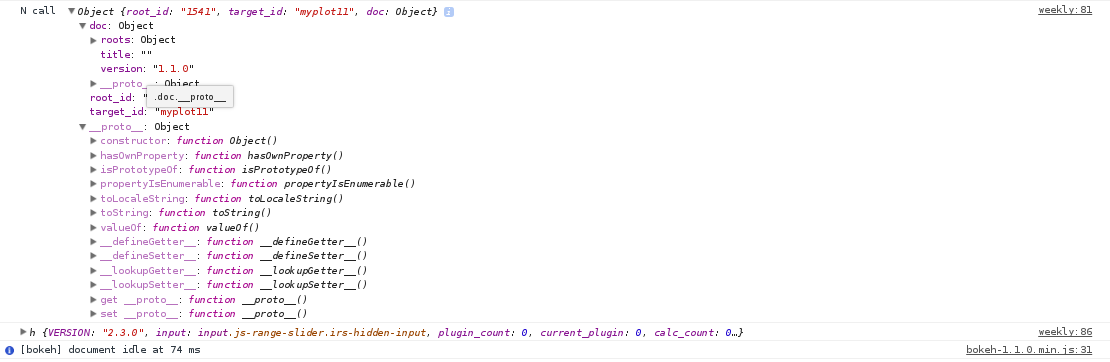
#create a json object which is passed by django the front end. N contains the plot itself xid is the root id which we don't need and start and end contain the plot start and end float times which will be something like 15023043ms
jsplot_ajcall = {'N': json_ODN_plot, 'xid':json_ODN_plot['root_id'], 'start': s_start, 'end': s_end }
HTML CODE DESIGNED TO INITALIZE THE SLIDER we are using the ION RANGE SLIDER
<div id="sliderDiv">
<input type="text" class="js-range-slider2" name="my_range2" value=""/>
</div>
JAVASCRIPT CODE
This code is to initalize the jquery slider in the ajax call
$.ajax({
    url: "{%url 'modaldataaj' %}", //call the view function as a ajax call
    type: 'GET',
    datatype: 'json',
    data: {'horizon':$( "#horizon" ).val() },
    success: function(jsplot_ajcall) {
            //empty the div container first
            $('#'+jsplot_ajcall.N.target_id).empty();
            var modalimg;
            modalimg = jsplot_ajcall.N;
            Bokeh.embed.embed_item(modalimg);

            if  ($( "#horizon" ).val() == 'Monthly') {
                var custom_valuesMonth = getTsArray(jsplot_ajcall.start, jsplot_ajcall.end, 'M');
                var to_Month = custom_valuesMonth.length;
                var $range2 = $(".js-range-slider2");
                let range_instance2 = $range2.data("ionRangeSlider");
                range_instance2.update({
                    from: 0, //jsplot_ajcall.start,
                    to: to_Month, //jsplot_ajcall.end,
                    values: custom_valuesMonth,
                    type: "double",
                    grid:true,
                    drag_interval:true,
                    prettify_enabled: true,
                });
            }
    })
Now if someone wants to adjust the ionrange slider to make it pretty and human readable based on there documenation the following jquery code will need to be used which i am also doing
The function to creat ea new moment array. You need the moment.js library which works with datetimes
var getTsArray = function (start, end, duration) {
	var arr = new Array();
	var ts = start;
	var endTs = end;

	while (ts <= endTs) {
		ts = moment(ts).add(1, duration);
		arr.push(ts);
	}
	return arr;
}
This jquery function is the magic of the ionrange slider. When you adjust the sliders the data will change accordingly of the bokeh plot
$(document).ready(function(){
	var output;
	var lang = "en-US";

	function datexxx(num){
         //this function is to prettify the values and make it human readable
		if  ($( "#horizon" ).val() == 'Monthly' ){
			var d = new Date(num);
			output = d.toLocaleDateString(lang, {
                    year: 'numeric',
                    month: 'short'
                })
		}
		return output;
	};


	//function to make adjust the slider and graph x axis
	$(".js-range-slider2").ionRangeSlider({
		prettify: datexxx,

		onChange: function (value) {
			console.log('ran on change');
			//console.log(Bokeh.index);
			//find the length of the bokeh index and take last value as this
			//is most recent data point value always
			varlen = Object.keys(Bokeh.index).length;
			varnum = Object.keys(Bokeh.index)[varlen-1];
			//console.log('start end from to', value.from, value.to, value.values, varlen, varnum, value.from_value, value.to_value );

			//initalize the bokeh source
			source = Bokeh.index[varnum].model;
			//override the x range start and end variables using values from slider input
			Bokeh.index[varnum].model.children[0].x_range.start = value.from_value;
			Bokeh.index[varnum].model.children[0].x_range.end = value.to_value;

			source.change.emit();
		},


	});
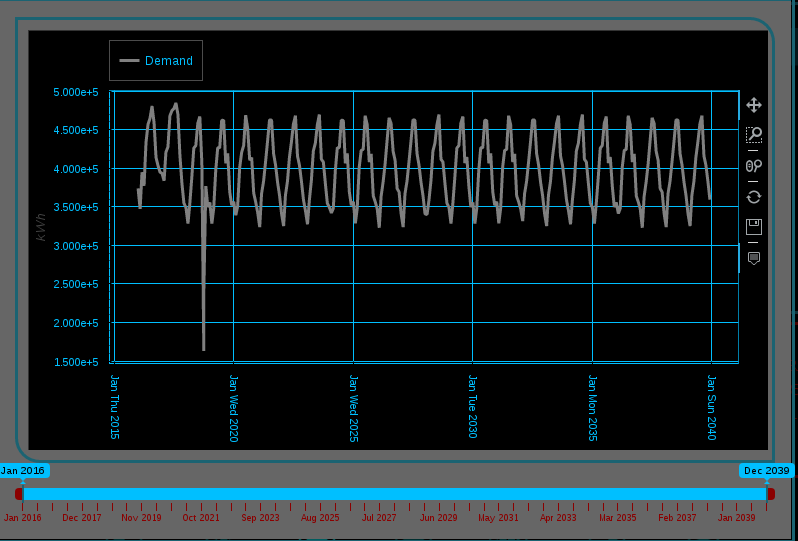
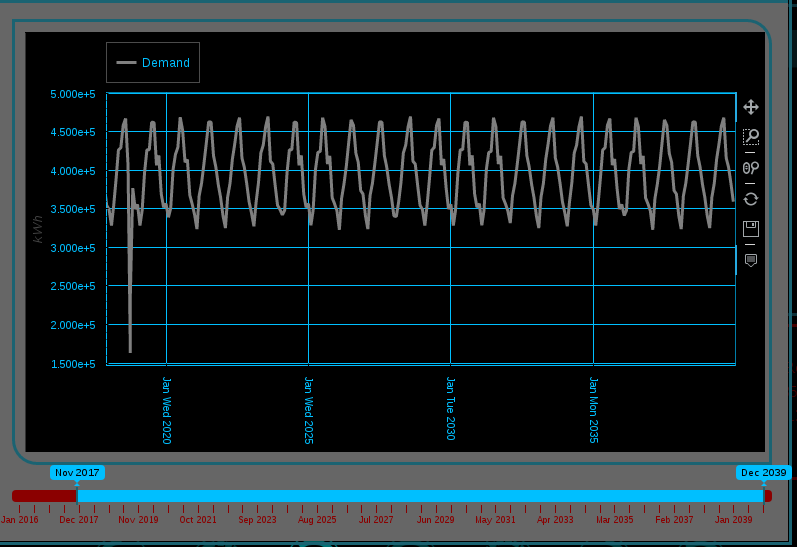
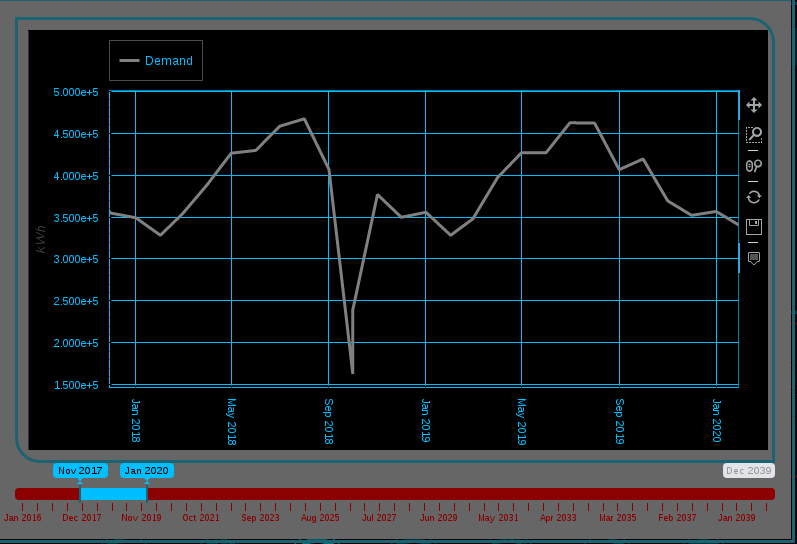
The result should be something like this: