Hi Team,
Bokeh Info
Python version        :  3.12.8 | packaged by Anaconda, Inc. | (main, Dec 11 2024, 16:48:34) [MSC v.1929 64 bit (AMD64)]
IPython version       :  8.27.0
Tornado version       :  6.4.2
NumPy version         :  1.26.4
Bokeh version         :  3.6.0
BokehJS static path   :  C:\ProgramData\anaconda3\envs\BOKEH\Lib\site-packages\bokeh\server\static
node.js version       :  (not installed)
npm version           :  (not installed)
jupyter_bokeh version :  4.0.5
Operating system      :  Windows-11-10.0.26100-SP0
I am trying to use the ScaleBar annotation in a figure with geographical data.
When measuring distances according to the scale, I found out that the latter is not accurate.
Here is I hope a minimal enough code to reproduce the problem, I am using a Jupyter notebook in VS Code version 1.96.0:
import panel as pn
pn.extension(sizing_mode='scale_both')
from bokeh.plotting import figure
from bokeh.models import ScaleBar
from bokeh.io import output_notebook, curdoc
curdoc().clear()
output_notebook()
from bokeh.models import WMTSTileSource
from holoviews.util.transform import lon_lat_to_easting_northing
from geopy.distance import geodesic
from math import sin, cos, sqrt, atan2, radians
from bokeh.util.info import print_info
print_info()
rue_copernic_28 = (2.2885813, 48.869313)
rue_copernic_32 = (2.288077, 48.869387)
def create_figure():
# définition des deux points (wgs84 vers PseudoMercator)
x_rue_copernic_28, y_rue_copernic_28 = lon_lat_to_easting_northing(*rue_copernic_28)
x_rue_copernic_32, y_rue_copernic_32 = lon_lat_to_easting_northing(*rue_copernic_32)
# création de la figure avec les coordoonées en mercator
fig = figure(x_axis_type='mercator', y_axis_type='mercator',
tools=['pan', 'box_zoom', 'wheel_zoom', 'save', 'reset'],
active_drag='pan', active_scroll='wheel_zoom',
title="Test échelles")
# utilisation du serveur en ligne de images tuilées
tiles = WMTSTileSource(url="https://data.geopf.fr/tms/1.0.0/GEOGRAPHICALGRIDSYSTEMS.PLANIGNV2/{Z}/{X}/{Y}.png",
name='PLAN IGN',
attribution="""
<a href="https://geoservices.ign.fr/services-web-decouverte" target="_blank">© Institut national de l'information géographique et forestière
</a>""",
max_zoom=19)
# ajout du fond de carte sur la figure
fig.add_tile(tiles)
# point 1
fig.scatter(x_rue_copernic_28, y_rue_copernic_28, size=18, color='red', marker='circle_cross', line_color='black', legend_label='28 Rue Copernic')
# point 2
fig.scatter(x_rue_copernic_32, y_rue_copernic_32, size=18, color='green', marker='circle_cross', line_color='black', legend_label='32 Rue Copernic')
# ajouter l'échelle seulement après avoir défini les limites
fig.add_layout(ScaleBar())
# mettre les légendes en bas à droite
fig.legend.location = 'bottom_right'
return fig
def calculer_distance_en_m(echelle_m, echelle_cm, mesure_cm):
return echelle_m * mesure_cm/echelle_cm
def haversine_distance(point1, point2):
# source : https://andrew.hedges.name/experiments/haversine/
# Approximate radius of earth in m
R = 6373.0*1e3
lat1 = radians(point1[1])
lon1 = radians(point1[0])
lat2 = radians(point2[1])
lon2 = radians(point2[0])
dlon = lon2 - lon1
dlat = lat2 - lat1
a = sin(dlat / 2)**2 + cos(lat1) * cos(lat2) * sin(dlon / 2)**2
c = 2 * atan2(sqrt(a), sqrt(1 - a))
return R * c
map_pane = pn.pane.Bokeh(create_figure())
echelle = pn.widgets.FloatInput(name='Value échelle (m)', value=15)
mesure = pn.widgets.FloatInput(name='Mesure échelle (cm)', value=3.6)
mesure_entre_deux_points = pn.widgets.FloatInput(name='Mesure (cm)', value=14.7)
bokeh_distance = pn.widgets.FloatInput(name='Distance selon échelle (m)', disabled=True, value=pn.bind(calculer_distance_en_m, echelle, mesure, mesure_entre_deux_points))
geopy_distance = pn.widgets.FloatInput(name='Distance calculée avec Geopy (m)', disabled=True, value=geodesic((rue_copernic_28[1], rue_copernic_28[0]), (rue_copernic_32[1],rue_copernic_32[0])).km*1e3)
haversine_distance = pn.widgets.FloatInput(name='Distance haversine (m)', disabled=True, value=haversine_distance(rue_copernic_28, rue_copernic_32))
layout = pn.Row(map_pane, pn.WidgetBox("### Mesures", echelle, mesure, mesure_entre_deux_points, bokeh_distance, geopy_distance, haversine_distance))
layout
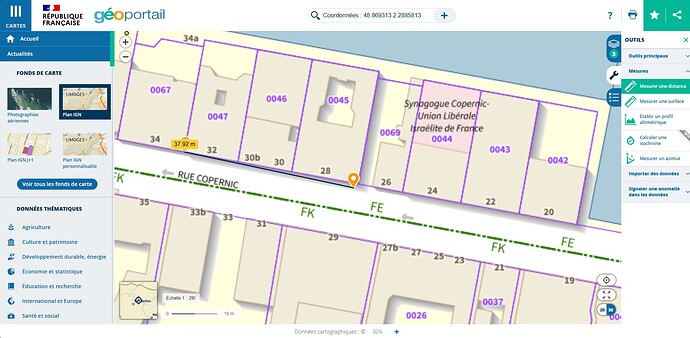
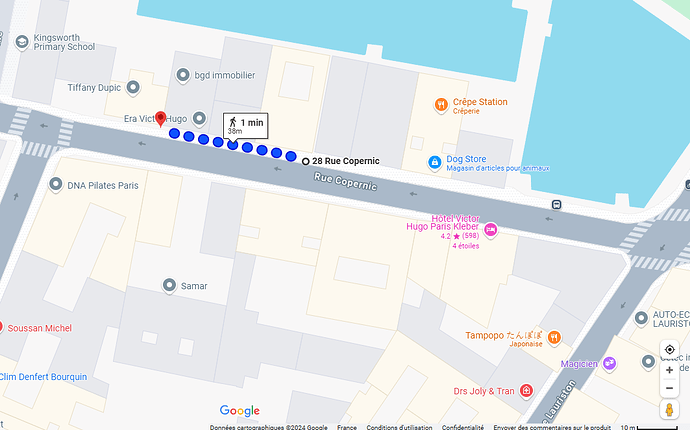
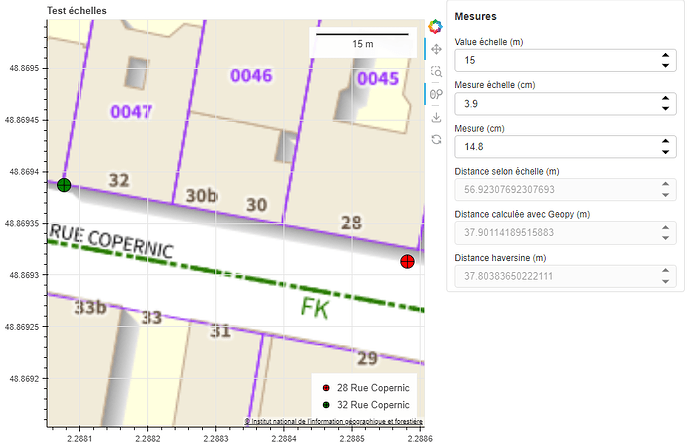
I compared with Geoportail (a French government site where we can analyse or visualize geographical data), Google Maps, Geopy’s distance.geodesic method and the Haversine formula and the measured distance is 38m. The distance calculated with the Bokeh ScaleBar is 57m.
The error might be that the longitude and the latitude are switched when computing the scale value in the Bokeh method (as I found the same distance with the Geopy method when I made that mistake).
I have tried to change the orientation, specify the fig.x_range or fig.y_range, put the fixed length for the bar but it was still incorrect.
Here are the results with other tools:
Here is the result of the example above:
Is this a bug or is there a parameter I could use to fix this?


