I am trying to plot lighting strikes on a scatter graph. It’s working fine with the caveat that it’s plotting a dot at 0 on the Y axis when I want no dot at all, just a blank space.
Here is how I’m building the list:
#Every minute(every time a obs_str comes in), add a blank line to lightning graph
                    if len(yStrikes) == 180:
                        yStrikes.pop(0)
                        xStrikes.pop(0)
                    xStrikes.append(datetime.now())
                    yStrikes.append(None)
                    l.writegraph(xStrikes, yStrikes)
And here is the class that is writing out the
 scatter plot:
class LightningGraph :
    def writegraph(self, xAxis, yAxis):
        try:
            output_file(filename="/var/www/html/lightning.html", title="Lightning Strikes")
            p = figure(title="Lightning Strikes", y_range=(0,40), x_axis_type="datetime", height=800, width=1400)
            p.scatter(xAxis, yAxis)
            p.xaxis.axis_label="Time Stamp"
            p.yaxis.axis_label="Distance KM"
            p.scatter(xAxis, yAxis)
            save(p)
        except Exception as e:
           raise Exception(e)
Results
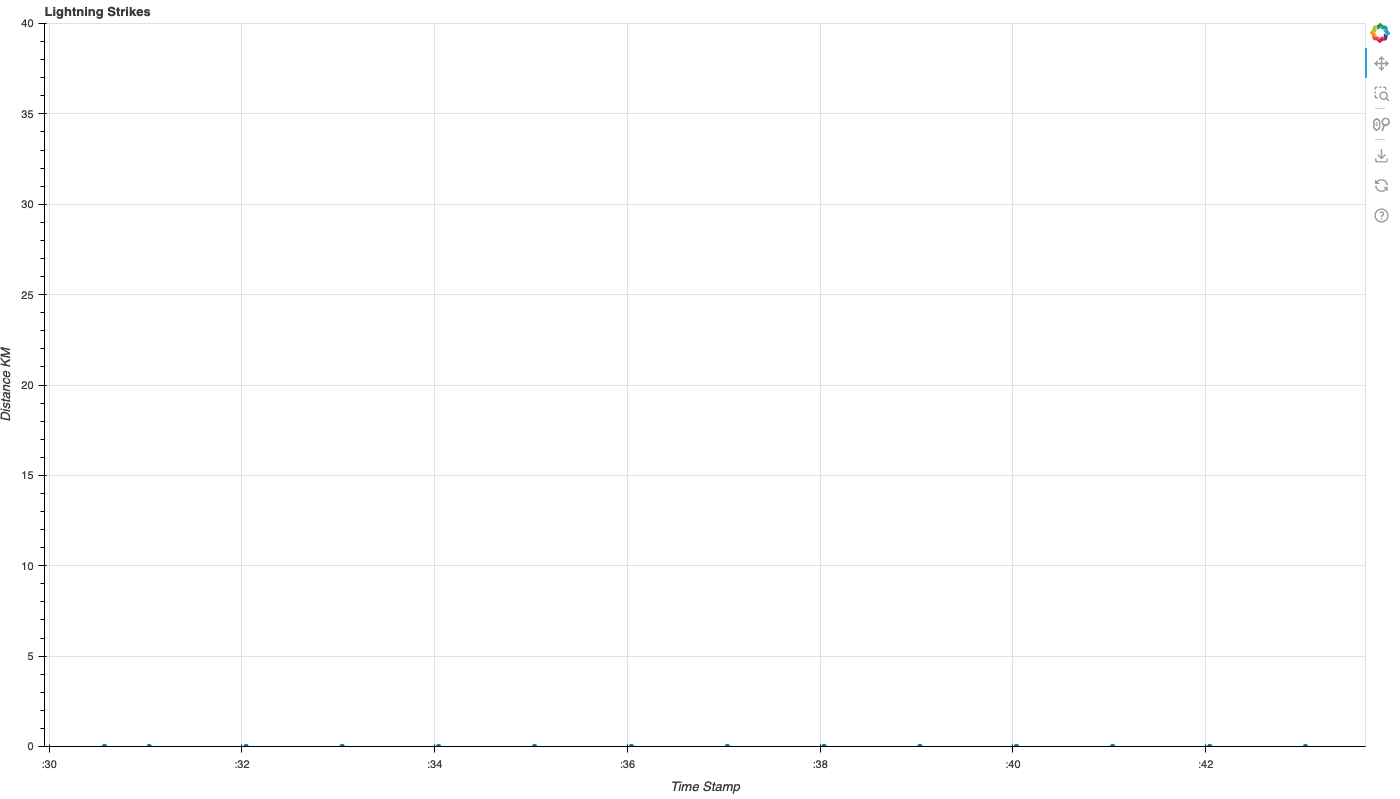
What I would like to have happen is those dots on the X axis to disappear and just display nothing if there is no data.