Hello everyone,
Trying to look at variation of values for each column of a CSV using scatter plot of Bokeh. I import the csv as a pandas dataframe, but facing issues on how to go about plotting it.
Here is a sample data set:
A B C
1.0 1.1 2.0
2.0 1.2 2.1
3.0 1.3 2.3
4.0 1.4 2.4
5.0 1.5 2.5
Looking at a way to plot where A , B, C are on the x- axis and planning to use jitter(jitter.py — Bokeh 2.4.2 Documentation) to see variation within A, B, C using a scatter plot.
Since A, B, C has a length of 3 and values has a length of 5, unable to do y vs x plot. I looked through the gallery and community support and couldn’t find examples. If someone can point out how to go about this, would appreciate it!
Thank you for your time.
A brute force or ugly way of going about this is having x as column_name*size(column_values). In this case, I will create a vector of size 5 with values of ‘A’. Similar for B and C.
If there is a simpler way of doing this then please share. Thank you.
You can either add a single data source where X column has multiple repeated values, or have 3 data sources, one per column, and create a scatter glyph for every one of them.
1 Like
I did try the above the method. Not sure what I am doing wrong. Tried to use https://docs.bokeh.org/en/latest/docs/gallery/bar_colormapped.html as a starting point. This (please see below code) generated a blank plot. Is there a way to look at scatter plot for a particular parameter? In this case, I am trying to plot scatter of values seen for string ‘Apples’ or ‘A’, ‘B’, ‘C’ of a csv data file in my original question.
Blockquote
fruits = [‘Apples’, ‘Apples’, ‘Apples’, ‘Apples’, ‘Apples’, ‘Apples’]
counts = [5, 3, 4, 2, 4, 6]
source = ColumnDataSource(data=dict(fruits=fruits, counts=counts))
p = figure(plot_height=350, toolbar_location=None, title=“Fruit Counts”)
p.circle(x=‘fruits’, y=‘counts’, width=0.9, source=source, legend_field=“fruits”)
show(p)
Looks like boxplot.py — Bokeh 2.4.2 Documentation might be the way to go for this type of analysis. Will confirm once I replicate it successfully.
That’s because you’re using a categorical value (fruits) without telling Bokeh about it. Just add x_range=sorted(set(fruits)) to the call to figure.
Thank you. Have a follow up. Is there a way to use jitter on categorical values? I do see an option at: transforms — Bokeh 3.3.2 Documentation , but unable to successfully implement.
Blockquote
fruits_apples = [‘Apples’, ‘Apples’, ‘Apples’, ‘Apples’, ‘Apples’, ‘Apples’]
counts_apples = [5, 3, 4, 2, 4, 6]
fruits_pears = [‘Pears’, ‘Pears’, ‘Pears’, ‘Pears’, ‘Pears’, ‘Pears’]
counts_pears = [2, 3, 1, 0, 3, 4]
fruits = [‘Apples’, ‘Pears’,‘Apples’, ‘Pears’,‘Apples’, ‘Pears’]
source = ColumnDataSource(data=dict(fruits_apples=fruits_apples, counts_apples=counts_apples,fruits_pears=fruits_pears,counts_pears=counts_pears,fruits=fruits))
p = figure(x_range=sorted(set(fruits)), plot_height=350, toolbar_location=None, title=“Fruit Counts”)
p.circle(x=‘fruits_apples’, y=‘counts_apples’, width=0.9, source=source, legend_field=“fruits”)
p.circle(x=‘fruits_pears’, y=‘counts_pears’, width=0.9, source=source, legend_field=“fruits”)
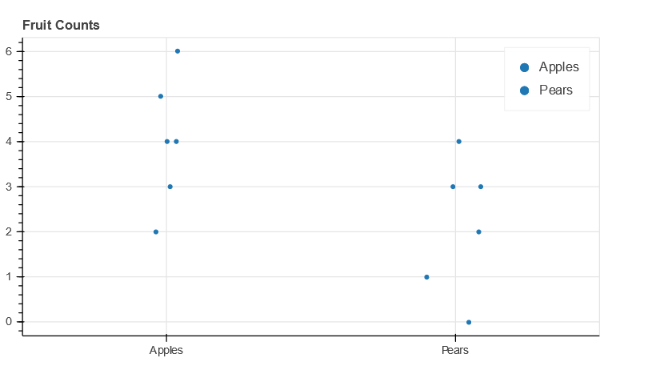
Here is the outcome:
Yes, it’s possible:
from bokeh.transform import jitter

p.circle(x=jitter('fruits_apples', 0.2, range=p.x_range),
         y='counts_apples', width=0.9, source=source, legend_field='fruits')
Thank you, appreciate your help. Planning to have boxplot with all points by it with jitter. I have all the building blocks successfully working now.
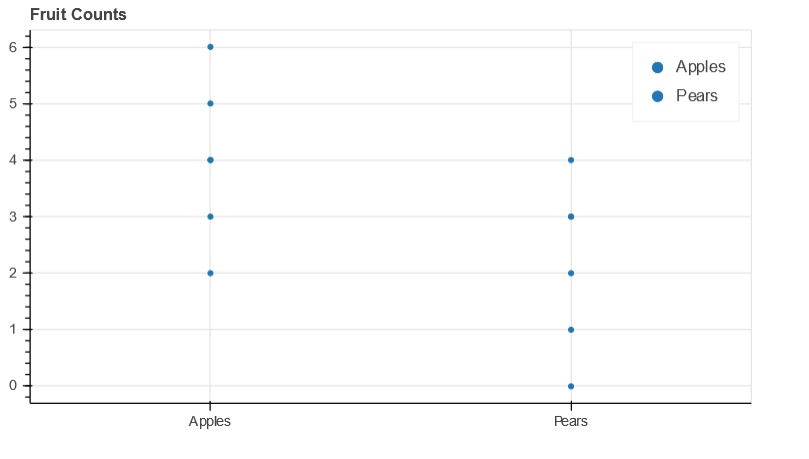
Following the above advice you should get: