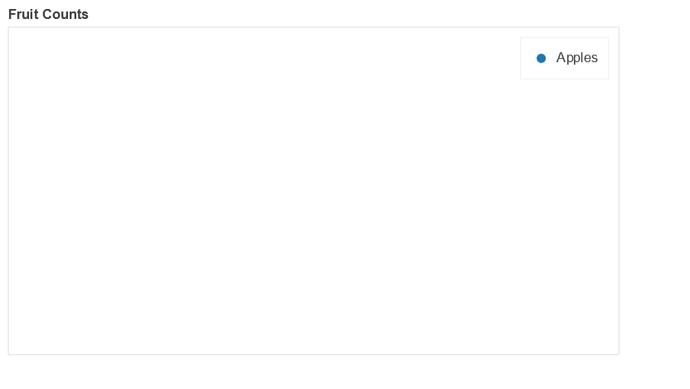
I did try the above the method. Not sure what I am doing wrong. Tried to use https://docs.bokeh.org/en/latest/docs/gallery/bar_colormapped.html as a starting point. This (please see below code) generated a blank plot. Is there a way to look at scatter plot for a particular parameter? In this case, I am trying to plot scatter of values seen for string ‘Apples’ or ‘A’, ‘B’, ‘C’ of a csv data file in my original question.
Blockquote
fruits = [‘Apples’, ‘Apples’, ‘Apples’, ‘Apples’, ‘Apples’, ‘Apples’]
counts = [5, 3, 4, 2, 4, 6]
source = ColumnDataSource(data=dict(fruits=fruits, counts=counts))
p = figure(plot_height=350, toolbar_location=None, title=“Fruit Counts”)
p.circle(x=‘fruits’, y=‘counts’, width=0.9, source=source, legend_field=“fruits”)
show(p)
