Good Day
I would like to know if its possible to generate a similar plot in bokeh as to
what is done with pcolormesh in this example:
https://docs.scipy.org/doc/scipy/reference/generated/scipy.signal.spectrogram.html
I have tried using bokeh’s image, but I am not sure if this is the correct approach.
I also see a similar post “Plot a spectrogram” on June 2018 but with no feedback.
Any support on this?
Thank you.
Yes, it should be more or less simple to use Bokeh’s image with a color map to create a pcolormesh with a regular grid. But an irregular grid would require some data massaging.
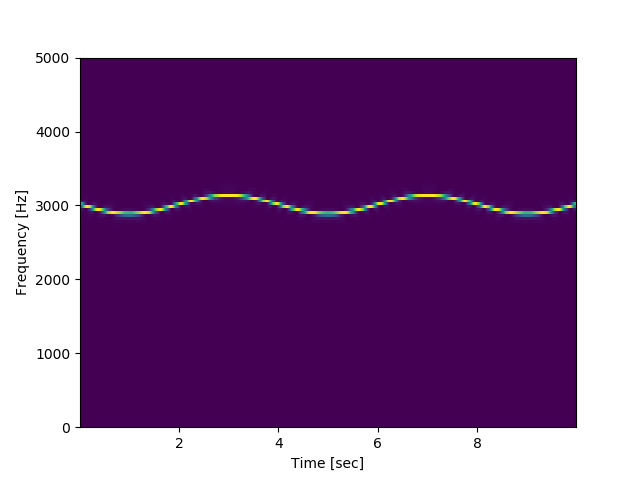
I think it would be an irregular grid, using this code:
from scipy.fftpack import fft
from scipy.fftpack import fftshift
import numpy as np
import matplotlib.pyplot as plt
import pandas as pd
fs = 10e3
N = 1e5
amp = 2 * np.sqrt(2)
time = np.arange(N) / float(fs)
mod = 500np.cos(2np.pi0.25time)
carrier = amp * np.sin(2np.pi3e3*time + mod)
x = carrier
f, t, Sxx = signal.spectrogram(x, fs)
plt.pcolormesh(t, f, Sxx)
plt.ylabel(‘Frequency [Hz]’)
plt.xlabel(‘Time [sec]’)
plt.show()
With the result below…