I’m trying to implement an interactive graph with more than 40 lines, each line represents a different function.
The problem is that the legend view isn’t large enough to contain all legends, is there a way to scroll over all the legends in the legend view? if so how?
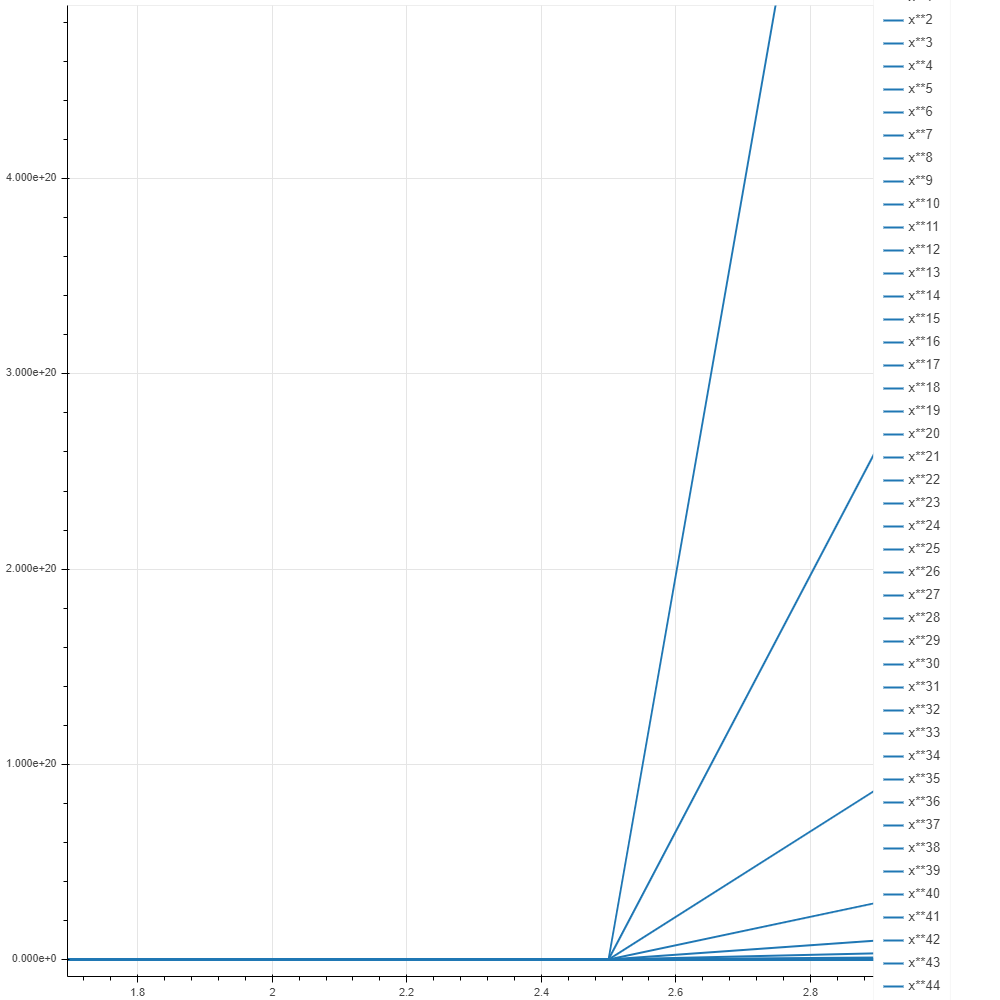
Attached is a screenshot of the graph I’m getting.
No such capability exists at present. Unfortunately it would be somewhat involved to implement this, as the legend is drawn manually on the raster HTML canvas. It is not a DOM element at all, so there is no machinery of the browser that could automatically be relied on. Various options:
* Creating a legend of your own outside the plot using DOM elements
* Creating a Bokeh Custom extension to make a DOM based legend
* Creating a Bokeh extension to make a scrollable canvas-based legend
You could make a GitHub issue to suggest this, but I don't think there would be resources to devote to it any time soon. However there is also an already existing issue to make rows be able to have an (nrows, ncols) layout. That might also solve you issue and I think has a much higher chance of being looked at relatively soon:
I'm trying to implement an interactive graph with more than 40 lines, each line represents a different function.
The problem is that the legend view isn't large enough to contain all legends, is there a way to scroll over all the legends in the legend view? if so how?
Attached is a screenshot of the graph I'm getting.