I would actually recommend that you check out the new HoloViews release:
[http://holoviews.org/](http://holoviews.org/)
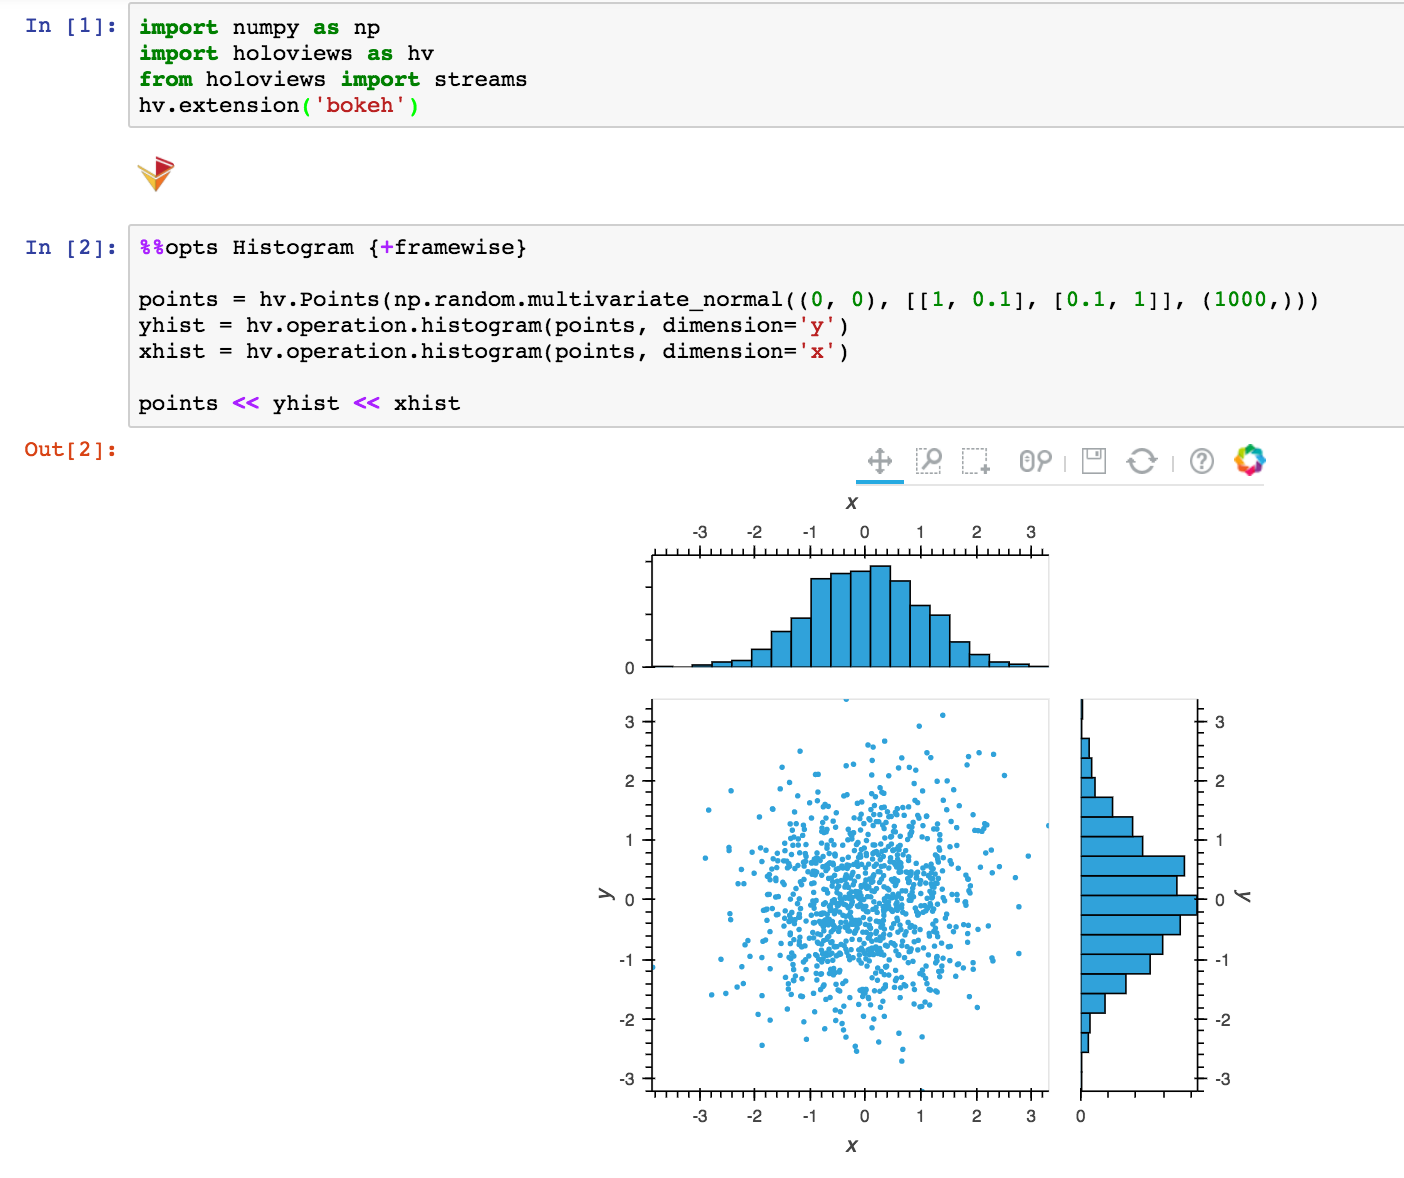
HoloViews is a very high-level API for data exploration that integrates tightly with Bokeh to produce statistical and other visualizations with less code. We will be advocating for users to use Holoviews (instead of the old bkcharts package) going forward.
Here is an example of a Bokeh joint plot created using Holoviews:
<image.png>
On Jun 30, 2017, at 11:33, 'Fabian Braennstroem' via Bokeh Discussion - Public <[email protected]> wrote:
Hello,
I would like to get a seaborn jointplot into bokeh.
The lines below work with the kdeplot, but not with the jointplot.
import seaborn as sns
from bokeh import mpl
import matplotlib.pyplot as plt
import pandas as pd
import numpy as np
from bokeh.io import show
On Jun 30, 2017, at 12:11, Bryan Van de ven [email protected] wrote:
Hi,
I would actually recommend that you check out the new HoloViews release:
[http://holoviews.org/](http://holoviews.org/)
HoloViews is a very high-level API for data exploration that integrates tightly with Bokeh to produce statistical and other visualizations with less code. We will be advocating for users to use Holoviews (instead of the old bkcharts package) going forward.
Here is an example of a Bokeh joint plot created using Holoviews:
<image.png>
On Jun 30, 2017, at 11:33, ‘Fabian Braennstroem’ via Bokeh Discussion - Public [email protected] wrote:
Hello,
I would like to get a seaborn jointplot into bokeh.
The lines below work with the kdeplot, but not with the jointplot.
import seaborn as sns
from bokeh import mpl
import matplotlib.pyplot as plt
import pandas as pd
import numpy as np
from bokeh.io import show
On Jun 30, 2017 7:21 PM, “Bryan Van de ven” [email protected] wrote:
Another cool updated version, in case you want multiple distributions on one plot:
On Jun 30, 2017, at 12:11, Bryan Van de ven [email protected] wrote:
Hi,
I would actually recommend that you check out the new HoloViews release:
[http://holoviews.org/](http://holoviews.org/)
HoloViews is a very high-level API for data exploration that integrates tightly with Bokeh to produce statistical and other visualizations with less code. We will be advocating for users to use Holoviews (instead of the old bkcharts package) going forward.
Here is an example of a Bokeh joint plot created using Holoviews:
<image.png>
On Jun 30, 2017, at 11:33, ‘Fabian Braennstroem’ via Bokeh Discussion - Public [email protected] wrote:
Hello,
I would like to get a seaborn jointplot into bokeh.
The lines below work with the kdeplot, but not with the jointplot.
import seaborn as sns
from bokeh import mpl
import matplotlib.pyplot as plt
import pandas as pd
import numpy as np
from bokeh.io import show
do you have an idea, if there is in option for a kde (see the 'kind' of jointplot in seaborn) plot as well? I could not figure this out yet; actually it does not look like that it exists.
HoloViews is a very high-level API for data exploration that integrates tightly with Bokeh to produce statistical and other visualizations with less code. We will be advocating for users to use Holoviews (instead of the old bkcharts package) going forward.
Here is an example of a Bokeh joint plot created using Holoviews:
<image.png>
On Jun 30, 2017, at 11:33, 'Fabian Braennstroem' via Bokeh >>>> Discussion - Public <[email protected]> wrote:
Hello,
I would like to get a seaborn jointplot into bokeh.
The lines below work with the kdeplot, but not with the jointplot.
import seaborn as sns
from bokeh import mpl
import matplotlib.pyplot as plt
import pandas as pd
import numpy as np
from bokeh.io import show
We used to have support for KDE plots in HoloViews via the matplotlib/seaborn compatibility that used to be in bokeh but that has since been dropped. We are hoping to add Elements representing 1D and 2D KDEs to HoloViews in one of the upcoming releases but can’t promise how soon that will happen. For now you could compute the KDE yourself and plot it as a Curve or Area.
All the Best,
Philipp
···
On Thursday, 6 July 2017 15:49:06 UTC+1, Fabian Braennstroem wrote:
Hello Bryan,
do you have an idea, if there is in option for a kde (see the
‘kind’ of jointplot in seaborn) plot as well? I could not figure
this out yet; actually it does not look like that it exists.
  Thank you in advance!

  Fabian


  On 06/30/2017 07:21 PM, Bryan Van de ven wrote:
      On Jun 30, 2017, at 12:11, > > > > Bryan Van de ven <[email protected]          > > > > > wrote:


      Hi,


      I would actually recommend that you check out the new
HoloViews release:
      	[http://holoviews.org/](http://holoviews.org/)


      HoloViews is a very high-level API for data exploration that
integrates tightly with Bokeh to produce statistical and other
visualizations with less code. We will be advocating for users
to use Holoviews (instead of the old bkcharts package) going
forward.
Here is an example of a Bokeh joint plot created using
Holoviews:
<image.png>
        On Jun 30, 2017, at 11:33, > > > > > 'Fabian Braennstroem' via Bokeh Discussion - Public > > > > > <[email protected]> wrote:


        Hello,


        I would like to get a seaborn jointplot into bokeh.


        The lines below work with the kdeplot, but not with the
jointplot.
        import seaborn as sns

        from bokeh import mpl

        import matplotlib.pyplot as plt

        import pandas as pd

        import numpy as np

        from [bokeh.io](http://bokeh.io) import show


        df = pd.DataFrame(np.random.            randint(0,100,size=(100, 4)),
columns=list(‘ABCD’))
        ax = sns.jointplot(x="A", y="B", data=df, kind="kde")

        # ax = sns.kdeplot(df["A"], df["B"])

        show(mpl.to_bokeh())


        Do you have a suggestion how to proceed with this? I assume
that I need somehow create several bokeh plots out of the
jointplot…
        Thank you!


        Best Regards


        Fabian


        --

        You received this message because you are subscribed to the
Google Groups “Bokeh Discussion - Public” group.
To unsubscribe from this group and stop receiving emails
        To post to this group, send email to [email protected].

To view this discussion on the web visit [https://groups.google.com/a/continuum.io/d/msgid/bokeh/B2397DB4-A496-44B3-8FA5-C636FA6C7E30%40continuum.io](https://groups.google.com/a/continuum.io/d/msgid/bokeh/B2397DB4-A496-44B3-8FA5-C636FA6C7E30%40continuum.io?utm_medium=email&utm_source=footer).
For more options, visit [https://groups.google.com/a/continuum.io/d/optout](https://groups.google.com/a/continuum.io/d/optout).
We used to have support for KDE plots in HoloViews via the matplotlib/seaborn compatibility that used to be in bokeh but that has since been dropped. We are hoping to add Elements representing 1D and 2D KDEs to HoloViews in one of the upcoming releases but can't promise how soon that will happen. For now you could compute the KDE yourself and plot it as a Curve or Area.
All the Best,
Philipp
On Thursday, 6 July 2017 15:49:06 UTC+1, Fabian Braennstroem wrote:
Hello Bryan,
do you have an idea, if there is in option for a kde (see the
'kind' of jointplot in seaborn) plot as well? I could not figure
this out yet; actually it does not look like that it exists.
Thank you in advance!
Fabian
On 06/30/2017 07:21 PM, Bryan Van de ven wrote:
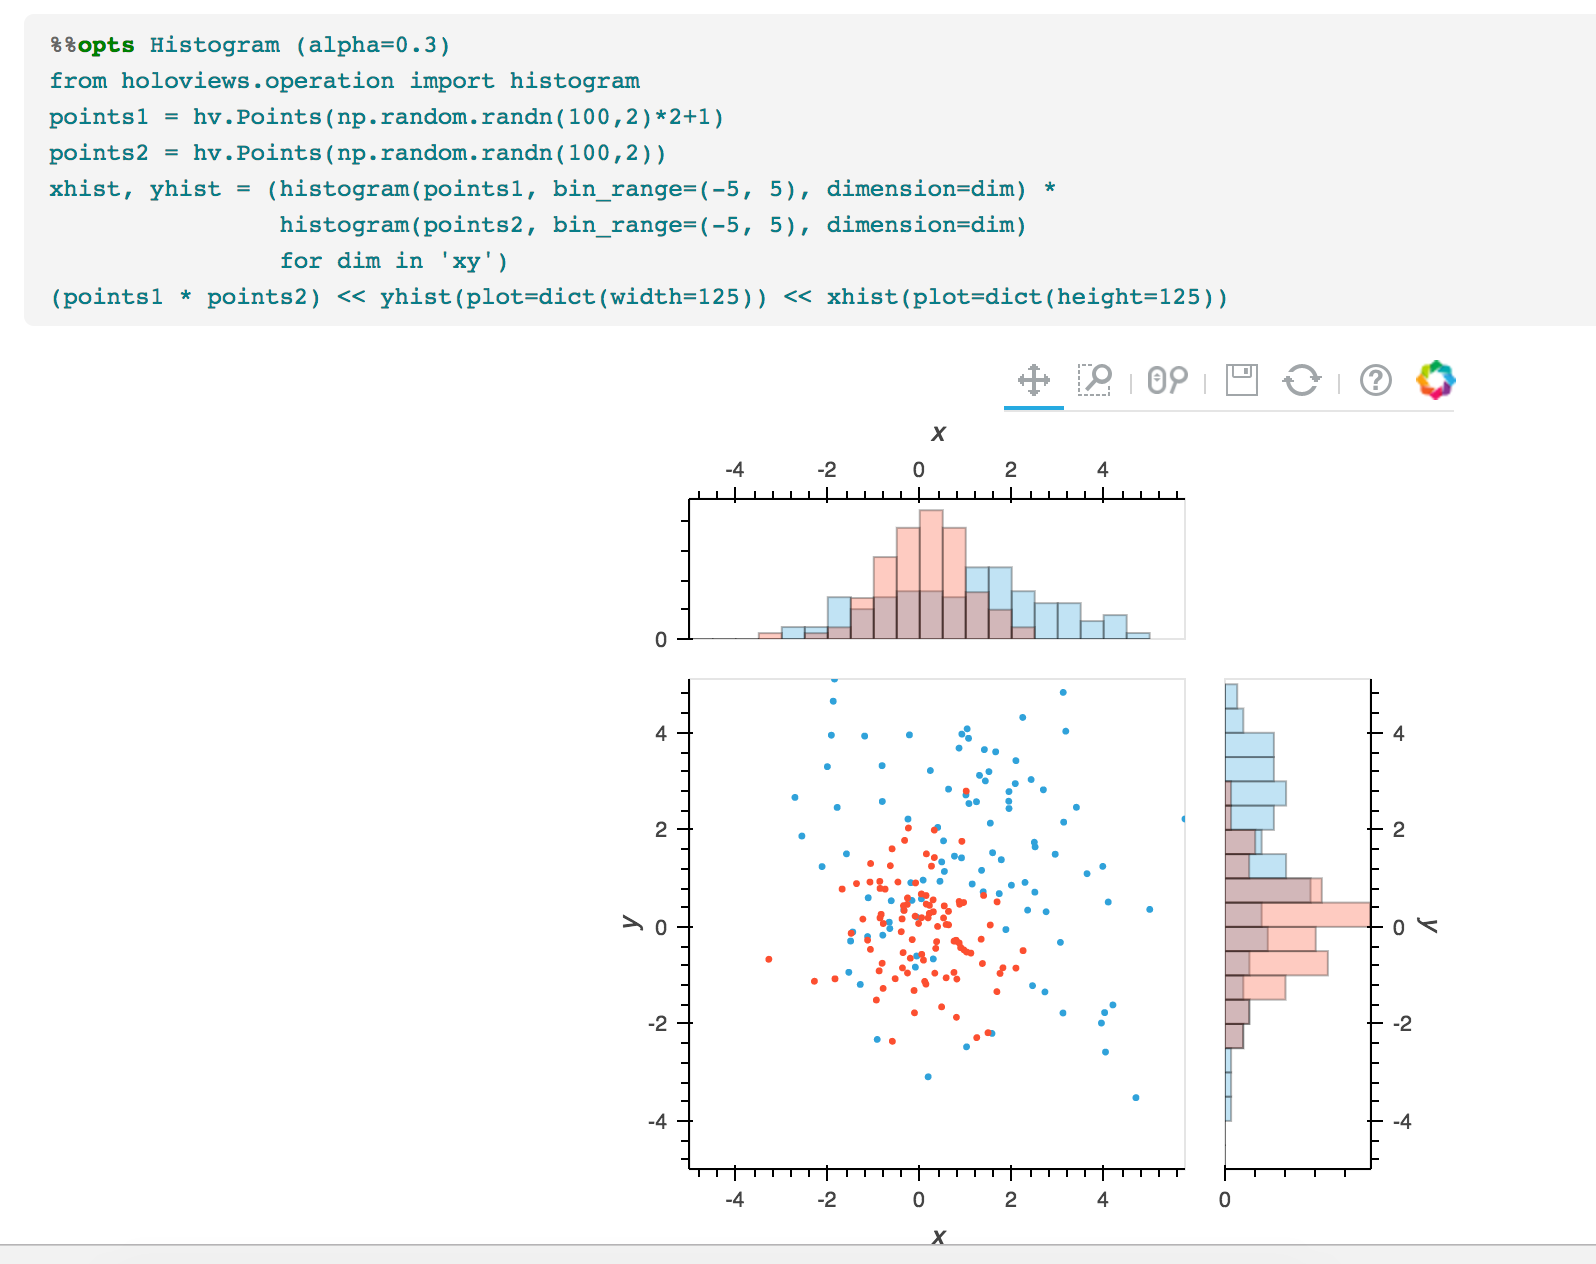
Another cool updated version, in case you want multiple
distributions on one plot:
On Jun 30, 2017, at 12:16, Bryan Van de ven <bry...@continuum.io >>> <javascript:>> wrote:
I was just informed this can be done even more simply
import numpy as np
import holoviews as hv
from holoviews.operation import histogram
hv.extension('bokeh')
HoloViews is a very high-level API for data exploration that
integrates tightly with Bokeh to produce statistical and other
visualizations with less code. We will be advocating for users
to use Holoviews (instead of the old bkcharts package) going
forward.
Here is an example of a Bokeh joint plot created using Holoviews:
<image.png>
On Jun 30, 2017, at 11:33, 'Fabian Braennstroem' via Bokeh >>>>> Discussion - Public <[email protected]> <javascript:> wrote:
Hello,
I would like to get a seaborn jointplot into bokeh.
The lines below work with the kdeplot, but not with the jointplot.
import seaborn as sns
from bokeh import mpl
import matplotlib.pyplot as plt
import pandas as pd
import numpy as np
from bokeh.io <http://bokeh.io> import show