In order to support and assist security analysts in hunting down threats and investigating incidents the Microsoft Threat Intelligence Center (MSTIC) has created a Python library made up of useful data analysis tools called MSTICpy . As part of this library we built Bokeh visualizations to support common analysis scenarios.
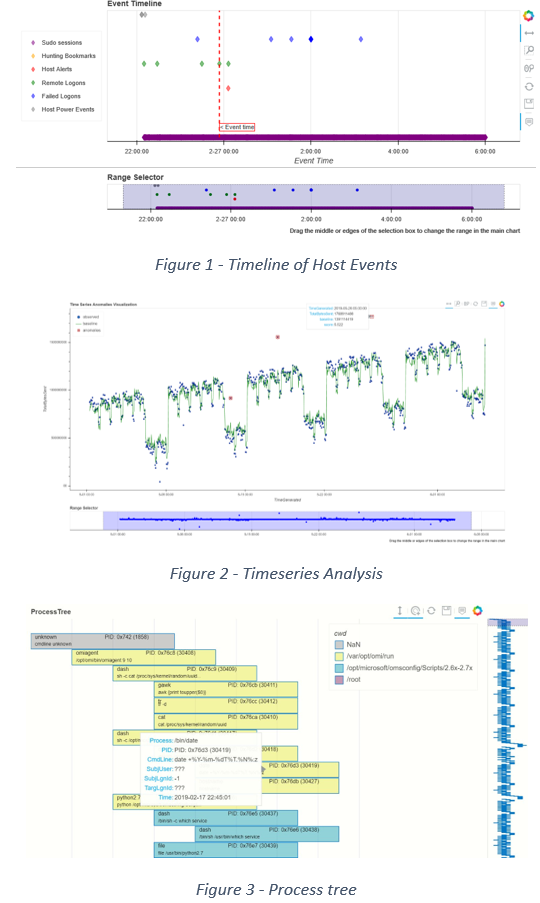
The first of these is a timeline visualization that plots a series of events across a time axis. It can display single points, or a running value and can plot multiple categories of events at once, with various overlays. Use cases for this include plotting log events to see a chronology of actions, or plotting metrics related to resource usage.
Another visualization we created is for process hierarchies on a host. This takes process creation event data from either Windows Event Logs or Linux Auditd, processes them into a connected tree and then visualizes these events for investigation.
For all of us on the team this has been our first time working with Bokeh but we have really valued the power and flexibility of it. The biggest challenges we faced have been around processing data correctly before visualization and simply learning all the features available to us via Bokeh to display exactly what we want.
We are continuing development of MSTICpy and are going to be adding more Bokeh visualizations over time. If anyone would like to contribute to MSTICpy we are always looking for suggestions and contributions from the community.