Selection jumping around when using DateRangeSider

I didn’t notice this problem until I added a “select” drop down menu to filter my report by year (2018 2017 etc…). I’m sure I have something wrong but I am not sure where. My plot circle’s column source data is selected by “df.ShipDate”. If my selection is, let’s say index 100 of the selectable group, then I scrub the slider, it appears it is maintaining the selection as index 100 but the record that was index 100 is now index 95. So as I scrub the selection is jumping all over the report to different records. Here is the function I added that I suspect caused this behaviour:

def update_slider(attr, old, new):

``
print(‘updating_slider’)

if select_year.value == str(date.today().year):

    start_date = str(date.today().year) + "-01-01"

    end_date = date.today().strftime('%Y-%m-%d')

else:

    start_date = select_year.value + "-01-01"

    end_date = select_year.value + "-12-31"    


new_start_date = start_date.replace("-", " ")

new_start_date = new_start_date.split(" ")

new_start_date = date(int(new_start_date[0]),int(new_start_date[1]),int(new_start_date[2]))

new_end_date = end_date.replace("-", " ")

new_end_date = new_end_date.split(" ")

new_end_date = date(int(new_end_date[0]),int(new_end_date[1]),int(new_end_date[2]))

date_range_slider.value=(new_start_date,new_end_date)

date_range_slider.start = new_start_date

date_range_slider.end = new_end_date    


p.x_range.start = new_start_date

p.x_range.end = new_end_date


print('update_complete')

This function is triggered by:

select_year.on_change(‘value’, update_slider)

``

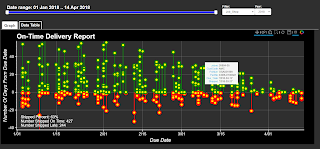
Here is a screenshot for reference:

Any Ideas what I might be doing wrong?

Update: I removed the year dropdown and still have this issue, so I am guessing the issue does not lie with the code I posted, but with a change I may have made to accomodate the year dropdown menu. Looking elsewhere at the moment.

···

On Saturday, April 14, 2018 at 8:15:36 AM UTC-4, beezerlm wrote:

I didn’t notice this problem until I added a “select” drop down menu to filter my report by year (2018 2017 etc…). I’m sure I have something wrong but I am not sure where. My plot circle’s column source data is selected by “df.ShipDate”. If my selection is, let’s say index 100 of the selectable group, then I scrub the slider, it appears it is maintaining the selection as index 100 but the record that was index 100 is now index 95. So as I scrub the selection is jumping all over the report to different records. Here is the function I added that I suspect caused this behaviour:

def update_slider(attr, old, new):

``
print(‘updating_slider’)

if select_year.value == str(date.today().year):
    start_date = str(date.today().year) + "-01-01"
    end_date = date.today().strftime('%Y-%m-%d')
else:
    start_date = select_year.value + "-01-01"
    end_date = select_year.value + "-12-31"    
new_start_date = start_date.replace("-", " ")
new_start_date = new_start_date.split(" ")
new_start_date = date(int(new_start_date[0]),int(new_start_date[1]),int(new_start_date[2]))
new_end_date = end_date.replace("-", " ")
new_end_date = new_end_date.split(" ")
new_end_date = date(int(new_end_date[0]),int(new_end_date[1]),int(new_end_date[2]))
date_range_slider.value=(new_start_date,new_end_date)
date_range_slider.start = new_start_date
date_range_slider.end = new_end_date    
p.x_range.start = new_start_date
p.x_range.end = new_end_date
print('update_complete')

This function is triggered by:

select_year.on_change(‘value’, update_slider)

``

Here is a screenshot for reference:

Any Ideas what I might be doing wrong?

One more thing to mention, I am getting a “Deserialization error” in the console every time the DateRangeSlider is updated, but I think this is caused by Tabs(). I am pretty sure the report still functioned properly even with the this error showing in the console.

···

On Saturday, April 14, 2018 at 8:19:49 AM UTC-4, beezerlm wrote:

Update: I removed the year dropdown and still have this issue, so I am guessing the issue does not lie with the code I posted, but with a change I may have made to accomodate the year dropdown menu. Looking elsewhere at the moment.

On Saturday, April 14, 2018 at 8:15:36 AM UTC-4, beezerlm wrote:

I didn’t notice this problem until I added a “select” drop down menu to filter my report by year (2018 2017 etc…). I’m sure I have something wrong but I am not sure where. My plot circle’s column source data is selected by “df.ShipDate”. If my selection is, let’s say index 100 of the selectable group, then I scrub the slider, it appears it is maintaining the selection as index 100 but the record that was index 100 is now index 95. So as I scrub the selection is jumping all over the report to different records. Here is the function I added that I suspect caused this behaviour:

def update_slider(attr, old, new):

``
print(‘updating_slider’)

if select_year.value == str(date.today().year):
    start_date = str(date.today().year) + "-01-01"
    end_date = date.today().strftime('%Y-%m-%d')
else:
    start_date = select_year.value + "-01-01"
    end_date = select_year.value + "-12-31"    
new_start_date = start_date.replace("-", " ")
new_start_date = new_start_date.split(" ")
new_start_date = date(int(new_start_date[0]),int(new_start_date[1]),int(new_start_date[2]))
new_end_date = end_date.replace("-", " ")
new_end_date = new_end_date.split(" ")
new_end_date = date(int(new_end_date[0]),int(new_end_date[1]),int(new_end_date[2]))
date_range_slider.value=(new_start_date,new_end_date)
date_range_slider.start = new_start_date
date_range_slider.end = new_end_date    
p.x_range.start = new_start_date
p.x_range.end = new_end_date
print('update_complete')

This function is triggered by:

select_year.on_change(‘value’, update_slider)

``

Here is a screenshot for reference:

Any Ideas what I might be doing wrong?

Update: It has nothing to do with tabs, I removed tabs which fixed the “Deserialization error”, but the selection behaviour is the same.

···

On Saturday, April 14, 2018 at 8:27:26 AM UTC-4, beezerlm wrote:

One more thing to mention, I am getting a “Deserialization error” in the console every time the DateRangeSlider is updated, but I think this is caused by Tabs(). I am pretty sure the report still functioned properly even with the this error showing in the console.

On Saturday, April 14, 2018 at 8:19:49 AM UTC-4, beezerlm wrote:

Update: I removed the year dropdown and still have this issue, so I am guessing the issue does not lie with the code I posted, but with a change I may have made to accomodate the year dropdown menu. Looking elsewhere at the moment.

On Saturday, April 14, 2018 at 8:15:36 AM UTC-4, beezerlm wrote:

I didn’t notice this problem until I added a “select” drop down menu to filter my report by year (2018 2017 etc…). I’m sure I have something wrong but I am not sure where. My plot circle’s column source data is selected by “df.ShipDate”. If my selection is, let’s say index 100 of the selectable group, then I scrub the slider, it appears it is maintaining the selection as index 100 but the record that was index 100 is now index 95. So as I scrub the selection is jumping all over the report to different records. Here is the function I added that I suspect caused this behaviour:

def update_slider(attr, old, new):

``
print(‘updating_slider’)

if select_year.value == str(date.today().year):
    start_date = str(date.today().year) + "-01-01"
    end_date = date.today().strftime('%Y-%m-%d')
else:
    start_date = select_year.value + "-01-01"
    end_date = select_year.value + "-12-31"    
new_start_date = start_date.replace("-", " ")
new_start_date = new_start_date.split(" ")
new_start_date = date(int(new_start_date[0]),int(new_start_date[1]),int(new_start_date[2]))
new_end_date = end_date.replace("-", " ")
new_end_date = new_end_date.split(" ")
new_end_date = date(int(new_end_date[0]),int(new_end_date[1]),int(new_end_date[2]))
date_range_slider.value=(new_start_date,new_end_date)
date_range_slider.start = new_start_date
date_range_slider.end = new_end_date    
p.x_range.start = new_start_date
p.x_range.end = new_end_date
print('update_complete')

This function is triggered by:

select_year.on_change(‘value’, update_slider)

``

Here is a screenshot for reference:

Any Ideas what I might be doing wrong?

I don't see anything at a glance. It's often the case that if I can actually run code, I can identify a problem quickly. If you can share a complete minimal reproducer, I'd be happy to take a closer look.

Thanks,

Bryan

···

On Apr 14, 2018, at 10:07, beezerlm <[email protected]> wrote:

Update: It has nothing to do with tabs, I removed tabs which fixed the "Deserialization error", but the selection behaviour is the same.

On Saturday, April 14, 2018 at 8:27:26 AM UTC-4, beezerlm wrote:
One more thing to mention, I am getting a "Deserialization error" in the console every time the DateRangeSlider is updated, but I think this is caused by Tabs(). I am pretty sure the report still functioned properly even with the this error showing in the console.

On Saturday, April 14, 2018 at 8:19:49 AM UTC-4, beezerlm wrote:
Update: I removed the year dropdown and still have this issue, so I am guessing the issue does not lie with the code I posted, but with a change I may have made to accomodate the year dropdown menu. Looking elsewhere at the moment.

On Saturday, April 14, 2018 at 8:15:36 AM UTC-4, beezerlm wrote:
I didn't notice this problem until I added a "select" drop down menu to filter my report by year (2018 2017 etc...). I'm sure I have something wrong but I am not sure where. My plot circle's column source data is selected by "df.ShipDate". If my selection is, let's say index 100 of the selectable group, then I scrub the slider, it appears it is maintaining the selection as index 100 but the record that was index 100 is now index 95. So as I scrub the selection is jumping all over the report to different records. Here is the function I added that I suspect caused this behaviour:

def update_slider(attr, old, new):
    print('updating_slider')
    
    if select_year.value == str(date.today().year):
        start_date = str(date.today().year) + "-01-01"
        end_date = date.today().strftime('%Y-%m-%d')
    else:
        start_date = select_year.value + "-01-01"
        end_date = select_year.value + "-12-31"
    
    new_start_date = start_date.replace("-", " ")
    new_start_date = new_start_date.split(" ")
    new_start_date = date(int(new_start_date[0]),int(new_start_date[1]),int(new_start_date[2]))

    new_end_date = end_date.replace("-", " ")
    new_end_date = new_end_date.split(" ")
    new_end_date = date(int(new_end_date[0]),int(new_end_date[1]),int(new_end_date[2]))

    date_range_slider.value=(new_start_date,new_end_date)
    date_range_slider.start = new_start_date
    date_range_slider.end = new_end_date
    
    p.x_range.start = new_start_date
    p.x_range.end = new_end_date
    
    print('update_complete')

This function is triggered by:

select_year.on_change('value', update_slider)

Here is a screenshot for reference:

Any Ideas what I might be doing wrong?

--
You received this message because you are subscribed to the Google Groups "Bokeh Discussion - Public" group.
To unsubscribe from this group and stop receiving emails from it, send an email to [email protected].
To post to this group, send email to [email protected].
To view this discussion on the web visit https://groups.google.com/a/continuum.io/d/msgid/bokeh/1c97cef3-68bc-4cbd-905c-a6b667a22cb0%40continuum.io\.
For more options, visit https://groups.google.com/a/continuum.io/d/optout\.

It appears I am not updated my source.selected properly. Here is the code for that section:

def update_plot(attr, old, new):

source.data = get_new_data(attr, old, new)

``

def get_new_data(attr, old, new):

try:

selected = source.selected

except:

print(“nothing selected…”)

start_date = date_range_slider.value_as_datetime[0]

end_date = date_range_slider.value_as_datetime[1]

mask = (df.ShipDate > start_date) & (df.ShipDate <= end_date)

cust_mask = (df.CustCode == select.value)

job_shop_mask = (df.WorkCode == ‘JOB SHOP’)

pultrusion_mask = (df.WorkCode == ‘PUL’)

if select.value == ‘All’:

pass

elif select.value == ‘Job_Shop’:

mask = mask & job_shop_mask

elif select.value == ‘Pul’:

mask = mask & pul_mask

else:

mask = mask & cust_mask

new_df = df[mask]

new_data = {

‘x’ : new_df.ShipDate,

‘x0’ : new_df.ShipDate,

‘x1’ : new_df.ShipDate,

‘y’ : new_df.DaysBeforeDue,

‘y1’ : new_df.DaysBeforeDue,

‘linecolor’ : [“green” if math.ceil(n) >= 0 else ‘red’ for n in new_df.DaysBeforeDue],

‘JobNo’ : new_df.JobNo,

‘PoNum’ : new_df.index,

‘PartNo’ : new_df.PartNo,

‘Due_Date’ : new_df.DueDate,

‘Shipped’ : new_df.ShipDate,

‘CustCode’ : new_df.CustCode

}

num_ontime = new_df.ShipDate[new_df.ShipDate <= new_df.DueDate].count()

num_late = new_df.ShipDate[new_df.ShipDate > new_df.DueDate].count()

percent_ontime = int(num_ontime / new_df.ShipDate.count() * 100)

label_ontime_num.text = 'Number Shipped On Time: ’ + str(num_ontime)

label_late_num.text = 'Number Shipped Late: ’ + str(num_late)

label_ship_percent.text = 'Shipped Percent: ’ + str(percent_ontime) + ‘%’

try:

print(‘selected’,source.selected)

print(‘selected.indices’,source.selected.indices)

print(‘selected.line_indices’,source.selected.line_indices)

print(‘selected.multiline_indices’,source.selected.multiline_indices)

source.trigger(“selected”, old, selected)

except:

print(‘source.trigger exception raised.’)

return new_data

``

···

On Saturday, April 14, 2018 at 11:07:40 AM UTC-4, beezerlm wrote:

Update: It has nothing to do with tabs, I removed tabs which fixed the “Deserialization error”, but the selection behaviour is the same.

On Saturday, April 14, 2018 at 8:27:26 AM UTC-4, beezerlm wrote:

One more thing to mention, I am getting a “Deserialization error” in the console every time the DateRangeSlider is updated, but I think this is caused by Tabs(). I am pretty sure the report still functioned properly even with the this error showing in the console.

On Saturday, April 14, 2018 at 8:19:49 AM UTC-4, beezerlm wrote:

Update: I removed the year dropdown and still have this issue, so I am guessing the issue does not lie with the code I posted, but with a change I may have made to accomodate the year dropdown menu. Looking elsewhere at the moment.

On Saturday, April 14, 2018 at 8:15:36 AM UTC-4, beezerlm wrote:

I didn’t notice this problem until I added a “select” drop down menu to filter my report by year (2018 2017 etc…). I’m sure I have something wrong but I am not sure where. My plot circle’s column source data is selected by “df.ShipDate”. If my selection is, let’s say index 100 of the selectable group, then I scrub the slider, it appears it is maintaining the selection as index 100 but the record that was index 100 is now index 95. So as I scrub the selection is jumping all over the report to different records. Here is the function I added that I suspect caused this behaviour:

def update_slider(attr, old, new):

``
print(‘updating_slider’)

if select_year.value == str(date.today().year):
    start_date = str(date.today().year) + "-01-01"
    end_date = date.today().strftime('%Y-%m-%d')
else:
    start_date = select_year.value + "-01-01"
    end_date = select_year.value + "-12-31"    
new_start_date = start_date.replace("-", " ")
new_start_date = new_start_date.split(" ")
new_start_date = date(int(new_start_date[0]),int(new_start_date[1]),int(new_start_date[2]))
new_end_date = end_date.replace("-", " ")
new_end_date = new_end_date.split(" ")
new_end_date = date(int(new_end_date[0]),int(new_end_date[1]),int(new_end_date[2]))
date_range_slider.value=(new_start_date,new_end_date)
date_range_slider.start = new_start_date
date_range_slider.end = new_end_date    
p.x_range.start = new_start_date
p.x_range.end = new_end_date
print('update_complete')

This function is triggered by:

select_year.on_change(‘value’, update_slider)

``

Here is a screenshot for reference:

Any Ideas what I might be doing wrong?

Bryan,

I will try to put a working example together. My code has become a bit unorganized I need to clean it up so it’s easier to follow.

···

On Saturday, April 14, 2018 at 11:42:37 AM UTC-4, Bryan Van de ven wrote:

I don’t see anything at a glance. It’s often the case that if I can actually run code, I can identify a problem quickly. If you can share a complete minimal reproducer, I’d be happy to take a closer look.

Thanks,

Bryan

On Apr 14, 2018, at 10:07, beezerlm [email protected] wrote:

Update: It has nothing to do with tabs, I removed tabs which fixed the “Deserialization error”, but the selection behaviour is the same.

On Saturday, April 14, 2018 at 8:27:26 AM UTC-4, beezerlm wrote:

One more thing to mention, I am getting a “Deserialization error” in the console every time the DateRangeSlider is updated, but I think this is caused by Tabs(). I am pretty sure the report still functioned properly even with the this error showing in the console.

On Saturday, April 14, 2018 at 8:19:49 AM UTC-4, beezerlm wrote:

Update: I removed the year dropdown and still have this issue, so I am guessing the issue does not lie with the code I posted, but with a change I may have made to accomodate the year dropdown menu. Looking elsewhere at the moment.

On Saturday, April 14, 2018 at 8:15:36 AM UTC-4, beezerlm wrote:

I didn’t notice this problem until I added a “select” drop down menu to filter my report by year (2018 2017 etc…). I’m sure I have something wrong but I am not sure where. My plot circle’s column source data is selected by “df.ShipDate”. If my selection is, let’s say index 100 of the selectable group, then I scrub the slider, it appears it is maintaining the selection as index 100 but the record that was index 100 is now index 95. So as I scrub the selection is jumping all over the report to different records. Here is the function I added that I suspect caused this behaviour:

def update_slider(attr, old, new):

print('updating_slider')
if select_year.value == str(date.today().year):
    start_date = str(date.today().year) + "-01-01"
    end_date = date.today().strftime('%Y-%m-%d')
else:
    start_date = select_year.value + "-01-01"
    end_date = select_year.value + "-12-31"    
new_start_date = start_date.replace("-", " ")
new_start_date = new_start_date.split(" ")
new_start_date = date(int(new_start_date[0]),int(new_start_date[1]),int(new_start_date[2]))
new_end_date = end_date.replace("-", " ")
new_end_date = new_end_date.split(" ")
new_end_date = date(int(new_end_date[0]),int(new_end_date[1]),int(new_end_date[2]))
date_range_slider.value=(new_start_date,new_end_date)
date_range_slider.start = new_start_date
date_range_slider.end = new_end_date    
p.x_range.start = new_start_date
p.x_range.end = new_end_date
print('update_complete')

This function is triggered by:

select_year.on_change(‘value’, update_slider)

Here is a screenshot for reference:

Any Ideas what I might be doing wrong?


You received this message because you are subscribed to the Google Groups “Bokeh Discussion - Public” group.

To unsubscribe from this group and stop receiving emails from it, send an email to [email protected].

To post to this group, send email to [email protected].

To view this discussion on the web visit https://groups.google.com/a/continuum.io/d/msgid/bokeh/1c97cef3-68bc-4cbd-905c-a6b667a22cb0%40continuum.io.

For more options, visit https://groups.google.com/a/continuum.io/d/optout.

Hi,

Well, setting (as opposed to reading only) selection is definitely not as thoroughly exercised a feature. Additionally, there was just a big change to use the Selection model (instead of the old cumbersome dict). So it's entirely possible there are just bugs. This is definitely a case that having an MRE to examine will help.

Thanks,

Bryan

···

On Apr 14, 2018, at 10:51, beezerlm <[email protected]> wrote:

Bryan,

     I will try to put a working example together. My code has become a bit unorganized I need to clean it up so it's easier to follow.

On Saturday, April 14, 2018 at 11:42:37 AM UTC-4, Bryan Van de ven wrote:
I don't see anything at a glance. It's often the case that if I can actually run code, I can identify a problem quickly. If you can share a complete minimal reproducer, I'd be happy to take a closer look.

Thanks,

Bryan

> On Apr 14, 2018, at 10:07, beezerlm <[email protected]> wrote:
>
> Update: It has nothing to do with tabs, I removed tabs which fixed the "Deserialization error", but the selection behaviour is the same.
>
> On Saturday, April 14, 2018 at 8:27:26 AM UTC-4, beezerlm wrote:
> One more thing to mention, I am getting a "Deserialization error" in the console every time the DateRangeSlider is updated, but I think this is caused by Tabs(). I am pretty sure the report still functioned properly even with the this error showing in the console.
>
> On Saturday, April 14, 2018 at 8:19:49 AM UTC-4, beezerlm wrote:
> Update: I removed the year dropdown and still have this issue, so I am guessing the issue does not lie with the code I posted, but with a change I may have made to accomodate the year dropdown menu. Looking elsewhere at the moment.
>
> On Saturday, April 14, 2018 at 8:15:36 AM UTC-4, beezerlm wrote:
> I didn't notice this problem until I added a "select" drop down menu to filter my report by year (2018 2017 etc...). I'm sure I have something wrong but I am not sure where. My plot circle's column source data is selected by "df.ShipDate". If my selection is, let's say index 100 of the selectable group, then I scrub the slider, it appears it is maintaining the selection as index 100 but the record that was index 100 is now index 95. So as I scrub the selection is jumping all over the report to different records. Here is the function I added that I suspect caused this behaviour:
>
> def update_slider(attr, old, new):
> print('updating_slider')
>
> if select_year.value == str(date.today().year):
> start_date = str(date.today().year) + "-01-01"
> end_date = date.today().strftime('%Y-%m-%d')
> else:
> start_date = select_year.value + "-01-01"
> end_date = select_year.value + "-12-31"
>
> new_start_date = start_date.replace("-", " ")
> new_start_date = new_start_date.split(" ")
> new_start_date = date(int(new_start_date[0]),int(new_start_date[1]),int(new_start_date[2]))
>
> new_end_date = end_date.replace("-", " ")
> new_end_date = new_end_date.split(" ")
> new_end_date = date(int(new_end_date[0]),int(new_end_date[1]),int(new_end_date[2]))
>
> date_range_slider.value=(new_start_date,new_end_date)
> date_range_slider.start = new_start_date
> date_range_slider.end = new_end_date
>
> p.x_range.start = new_start_date
> p.x_range.end = new_end_date
>
> print('update_complete')
>
>
> This function is triggered by:
>
> select_year.on_change('value', update_slider)
>
>
> Here is a screenshot for reference:
>
>
>
> Any Ideas what I might be doing wrong?
>
> --
> You received this message because you are subscribed to the Google Groups "Bokeh Discussion - Public" group.
> To unsubscribe from this group and stop receiving emails from it, send an email to bokeh+un...@continuum.io.
> To post to this group, send email to bo...@continuum.io.
> To view this discussion on the web visit https://groups.google.com/a/continuum.io/d/msgid/bokeh/1c97cef3-68bc-4cbd-905c-a6b667a22cb0%40continuum.io\.
> For more options, visit https://groups.google.com/a/continuum.io/d/optout\.

--
You received this message because you are subscribed to the Google Groups "Bokeh Discussion - Public" group.
To unsubscribe from this group and stop receiving emails from it, send an email to [email protected].
To post to this group, send email to [email protected].
To view this discussion on the web visit https://groups.google.com/a/continuum.io/d/msgid/bokeh/74dcd14d-964f-4955-ac4e-171f6d39b0a9%40continuum.io\.
For more options, visit https://groups.google.com/a/continuum.io/d/optout\.

Here is a working example. If you select the April 2nd and May 1st records, then slide the left bar past April 2nd, you will see the selection jump to the right.

import pandas as pd

import numpy as np

import math

from datetime import date, datetime

from bokeh.plotting import figure

from bokeh.layouts import widgetbox, row, column

from bokeh.models import ColumnDataSource, HoverTool, CustomJS, WheelZoomTool, Label, LabelSet

from bokeh.models.widgets import DateRangeSlider, Div, Select, Tabs, Panel, TableColumn, DataTable, DateFormatter

from bokeh.io import curdoc, show, output_file, save

def update_plot(attr, old, new):

try:

    selected = source.selected

except:

    print("nothing selected...")


start_date = date_range_slider.value_as_datetime[0]

end_date = date_range_slider.value_as_datetime[1]


mask = (df.ShipDate > start_date) & (df.ShipDate <= end_date)


new_df = df[mask]    

new_data = {

            'x'              : new_df.ShipDate,

            'x0'             : new_df.ShipDate,

            'x1'             : new_df.ShipDate,

            'y'              : new_df.DaysBeforeDue,

            'y1'             : new_df.DaysBeforeDue


            }

try:

    print('selected',source.selected)

    print('selected.indices',source.selected.indices)

    print('selected.line_indices',source.selected.line_indices)

    print('selected.multiline_indices',source.selected.multiline_indices)

    source.selected = selected

except:

    print('source.trigger exception raised.')


source.data = new_data

def update_slider(attr, old, new):

print('updating_slider')


if select_year.value == str(date.today().year):

    start_date = str(date.today().year) + "-01-01"

    end_date = date.today().strftime('%Y-%m-%d')

else:

    start_date = select_year.value + "-01-01"

    end_date = select_year.value + "-12-31"    


new_start_date = start_date.replace("-", " ")

new_start_date = new_start_date.split(" ")

new_start_date = date(int(new_start_date[0]),int(new_start_date[1]),int(new_start_date[2]))

new_end_date = end_date.replace("-", " ")

new_end_date = new_end_date.split(" ")

new_end_date = date(int(new_end_date[0]),int(new_end_date[1]),int(new_end_date[2]))

date_range_slider.value = (new_start_date,new_end_date)

date_range_slider.start = new_start_date

date_range_slider.end = new_end_date    


p.x_range.start = new_start_date

p.x_range.end = new_end_date


update_plot()

print('update_complete')

df = pd.DataFrame()

df[‘ShipDate’] = [pd.Timestamp(‘2017-04-02’), pd.Timestamp(‘2017-05-01’), pd.Timestamp(‘2017-08-01’)]

df[‘DaysBeforeDue’] = [50, 37, 65]

print(df)

start_date = ‘2017-04-01’

end_date = ‘2017-08-01’

source = ColumnDataSource(data={‘x’ : df.ShipDate,

                            'x0'             : df.ShipDate,

                            'x1'             : df.ShipDate,

                            'y'              : df.DaysBeforeDue,

                            'y1'             : df.DaysBeforeDue


                           })

x_range = (pd.Timestamp(‘2017-03-01’),df.ShipDate.max())

y_range = (-75, 75)

p = figure(plot_width=1500,

       plot_height=550,

       title='On-Time Delivery Report ', 

       tools=('pan','tap','reset','save','poly_select', 'wheel_zoom'),

       sizing_mode='scale_width',

       x_range=(x_range),

       y_range=(y_range)) 

p.segment(x0=‘x0’, y0=0, x1=‘x1’, y1=‘y1’, line_color=‘green’, line_width=3, source=source)

p.circle(‘x’, ‘y’, size=15, selection_color = ‘yellow’, fill_color=‘yellow’, line_color=‘green’, line_width=5, nonselection_alpha=0.5, name=‘circle’, source=source)

p.xaxis.axis_label = “Due Date”

p.yaxis.axis_label = “Number Of Days From Due Date”

new_start_date = start_date.replace(“-”, " ")

new_start_date = new_start_date.split(" ")

new_start_date = date(int(new_start_date[0]),int(new_start_date[1]),int(new_start_date[2]))

new_end_date = end_date.replace(“-”, " ")

new_end_date = new_end_date.split(" ")

new_end_date = date(int(new_end_date[0]),int(new_end_date[1]),int(new_end_date[2]))

date_range_slider = DateRangeSlider(title=“Date range”,

                                value=(new_start_date, new_end_date),

                                start=new_start_date,

                                end=new_end_date,

                                step=1,

                                css_classes=["custom_slider"]

                                )

date_range_slider.on_change(‘value’, update_plot)

layout = row(p, sizing_mode=‘scale_width’)

widget_box = widgetbox(date_range_slider, sizing_mode=‘scale_width’, height=70)

update_plot(‘attr’,‘old’,‘new’)

curdoc().add_root(widget_box)

curdoc().add_root(layout)

curdoc().title = ‘On-Time Delivery Report’

``

···

On Saturday, April 14, 2018 at 11:56:23 AM UTC-4, Bryan Van de ven wrote:

Hi,

Well, setting (as opposed to reading only) selection is definitely not as thoroughly exercised a feature. Additionally, there was just a big change to use the Selection model (instead of the old cumbersome dict). So it’s entirely possible there are just bugs. This is definitely a case that having an MRE to examine will help.

Thanks,

Bryan

On Apr 14, 2018, at 10:51, beezerlm [email protected] wrote:

Bryan,

 I will try to put a working example together.  My code has become a bit unorganized I need to clean it up so it's easier to follow.

On Saturday, April 14, 2018 at 11:42:37 AM UTC-4, Bryan Van de ven wrote:

I don’t see anything at a glance. It’s often the case that if I can actually run code, I can identify a problem quickly. If you can share a complete minimal reproducer, I’d be happy to take a closer look.

Thanks,

Bryan

On Apr 14, 2018, at 10:07, beezerlm [email protected] wrote:

Update: It has nothing to do with tabs, I removed tabs which fixed the “Deserialization error”, but the selection behaviour is the same.

On Saturday, April 14, 2018 at 8:27:26 AM UTC-4, beezerlm wrote:
One more thing to mention, I am getting a “Deserialization error” in the console every time the DateRangeSlider is updated, but I think this is caused by Tabs(). I am pretty sure the report still functioned properly even with the this error showing in the console.

On Saturday, April 14, 2018 at 8:19:49 AM UTC-4, beezerlm wrote:
Update: I removed the year dropdown and still have this issue, so I am guessing the issue does not lie with the code I posted, but with a change I may have made to accomodate the year dropdown menu. Looking elsewhere at the moment.

On Saturday, April 14, 2018 at 8:15:36 AM UTC-4, beezerlm wrote:
I didn’t notice this problem until I added a “select” drop down menu to filter my report by year (2018 2017 etc…). I’m sure I have something wrong but I am not sure where. My plot circle’s column source data is selected by “df.ShipDate”. If my selection is, let’s say index 100 of the selectable group, then I scrub the slider, it appears it is maintaining the selection as index 100 but the record that was index 100 is now index 95. So as I scrub the selection is jumping all over the report to different records. Here is the function I added that I suspect caused this behaviour:

def update_slider(attr, old, new):
print(‘updating_slider’)

if select_year.value == str(date.today().year):
    start_date = str(date.today().year) + "-01-01"
    end_date = date.today().strftime('%Y-%m-%d')
else:
    start_date = select_year.value + "-01-01"
    end_date = select_year.value + "-12-31"    

new_start_date = start_date.replace("-", " ")
new_start_date = new_start_date.split(" ")
new_start_date = date(int(new_start_date[0]),int(new_start_date[1]),int(new_start_date[2]))

new_end_date = end_date.replace("-", " ")
new_end_date = new_end_date.split(" ")
new_end_date = date(int(new_end_date[0]),int(new_end_date[1]),int(new_end_date[2]))

date_range_slider.value=(new_start_date,new_end_date)
date_range_slider.start = new_start_date
date_range_slider.end = new_end_date    

p.x_range.start = new_start_date
p.x_range.end = new_end_date

print('update_complete')

This function is triggered by:

select_year.on_change(‘value’, update_slider)

Here is a screenshot for reference:

Any Ideas what I might be doing wrong?


You received this message because you are subscribed to the Google Groups “Bokeh Discussion - Public” group.
To unsubscribe from this group and stop receiving emails from it, send an email to [email protected].
To post to this group, send email to [email protected].
To view this discussion on the web visit https://groups.google.com/a/continuum.io/d/msgid/bokeh/1c97cef3-68bc-4cbd-905c-a6b667a22cb0%40continuum.io.
For more options, visit https://groups.google.com/a/continuum.io/d/optout.


You received this message because you are subscribed to the Google Groups “Bokeh Discussion - Public” group.

To unsubscribe from this group and stop receiving emails from it, send an email to [email protected].

To post to this group, send email to [email protected].

To view this discussion on the web visit https://groups.google.com/a/continuum.io/d/msgid/bokeh/74dcd14d-964f-4955-ac4e-171f6d39b0a9%40continuum.io.

For more options, visit https://groups.google.com/a/continuum.io/d/optout.

Hi Bryan, Did you get a chance to review the example I posted? Am I doing something wrong here?

···

On Saturday, April 14, 2018 at 11:56:23 AM UTC-4, Bryan Van de ven wrote:

Hi,

Well, setting (as opposed to reading only) selection is definitely not as thoroughly exercised a feature. Additionally, there was just a big change to use the Selection model (instead of the old cumbersome dict). So it’s entirely possible there are just bugs. This is definitely a case that having an MRE to examine will help.

Thanks,

Bryan

On Apr 14, 2018, at 10:51, beezerlm [email protected] wrote:

Bryan,

 I will try to put a working example together.  My code has become a bit unorganized I need to clean it up so it's easier to follow.

On Saturday, April 14, 2018 at 11:42:37 AM UTC-4, Bryan Van de ven wrote:

I don’t see anything at a glance. It’s often the case that if I can actually run code, I can identify a problem quickly. If you can share a complete minimal reproducer, I’d be happy to take a closer look.

Thanks,

Bryan

On Apr 14, 2018, at 10:07, beezerlm [email protected] wrote:

Update: It has nothing to do with tabs, I removed tabs which fixed the “Deserialization error”, but the selection behaviour is the same.

On Saturday, April 14, 2018 at 8:27:26 AM UTC-4, beezerlm wrote:
One more thing to mention, I am getting a “Deserialization error” in the console every time the DateRangeSlider is updated, but I think this is caused by Tabs(). I am pretty sure the report still functioned properly even with the this error showing in the console.

On Saturday, April 14, 2018 at 8:19:49 AM UTC-4, beezerlm wrote:
Update: I removed the year dropdown and still have this issue, so I am guessing the issue does not lie with the code I posted, but with a change I may have made to accomodate the year dropdown menu. Looking elsewhere at the moment.

On Saturday, April 14, 2018 at 8:15:36 AM UTC-4, beezerlm wrote:
I didn’t notice this problem until I added a “select” drop down menu to filter my report by year (2018 2017 etc…). I’m sure I have something wrong but I am not sure where. My plot circle’s column source data is selected by “df.ShipDate”. If my selection is, let’s say index 100 of the selectable group, then I scrub the slider, it appears it is maintaining the selection as index 100 but the record that was index 100 is now index 95. So as I scrub the selection is jumping all over the report to different records. Here is the function I added that I suspect caused this behaviour:

def update_slider(attr, old, new):
print(‘updating_slider’)

if select_year.value == str(date.today().year):
    start_date = str(date.today().year) + "-01-01"
    end_date = date.today().strftime('%Y-%m-%d')
else:
    start_date = select_year.value + "-01-01"
    end_date = select_year.value + "-12-31"    

new_start_date = start_date.replace("-", " ")
new_start_date = new_start_date.split(" ")
new_start_date = date(int(new_start_date[0]),int(new_start_date[1]),int(new_start_date[2]))

new_end_date = end_date.replace("-", " ")
new_end_date = new_end_date.split(" ")
new_end_date = date(int(new_end_date[0]),int(new_end_date[1]),int(new_end_date[2]))

date_range_slider.value=(new_start_date,new_end_date)
date_range_slider.start = new_start_date
date_range_slider.end = new_end_date    

p.x_range.start = new_start_date
p.x_range.end = new_end_date

print('update_complete')

This function is triggered by:

select_year.on_change(‘value’, update_slider)

Here is a screenshot for reference:

Any Ideas what I might be doing wrong?


You received this message because you are subscribed to the Google Groups “Bokeh Discussion - Public” group.
To unsubscribe from this group and stop receiving emails from it, send an email to [email protected].
To post to this group, send email to [email protected].
To view this discussion on the web visit https://groups.google.com/a/continuum.io/d/msgid/bokeh/1c97cef3-68bc-4cbd-905c-a6b667a22cb0%40continuum.io.
For more options, visit https://groups.google.com/a/continuum.io/d/optout.


You received this message because you are subscribed to the Google Groups “Bokeh Discussion - Public” group.

To unsubscribe from this group and stop receiving emails from it, send an email to [email protected].

To post to this group, send email to [email protected].

To view this discussion on the web visit https://groups.google.com/a/continuum.io/d/msgid/bokeh/74dcd14d-964f-4955-ac4e-171f6d39b0a9%40continuum.io.

For more options, visit https://groups.google.com/a/continuum.io/d/optout.

Not yet, I’m fairly overwhelmed at the moment.

Bryan

···

On Apr 19, 2018, at 04:14, beezerlm [email protected] wrote:

Hi Bryan, Did you get a chance to review the example I posted? Am I doing something wrong here?

On Saturday, April 14, 2018 at 11:56:23 AM UTC-4, Bryan Van de ven wrote:

Hi,

Well, setting (as opposed to reading only) selection is definitely not as thoroughly exercised a feature. Additionally, there was just a big change to use the Selection model (instead of the old cumbersome dict). So it’s entirely possible there are just bugs. This is definitely a case that having an MRE to examine will help.

Thanks,

Bryan

On Apr 14, 2018, at 10:51, beezerlm [email protected] wrote:

Bryan,

 I will try to put a working example together.  My code has become a bit unorganized I need to clean it up so it's easier to follow.

On Saturday, April 14, 2018 at 11:42:37 AM UTC-4, Bryan Van de ven wrote:

I don’t see anything at a glance. It’s often the case that if I can actually run code, I can identify a problem quickly. If you can share a complete minimal reproducer, I’d be happy to take a closer look.

Thanks,

Bryan

On Apr 14, 2018, at 10:07, beezerlm [email protected] wrote:

Update: It has nothing to do with tabs, I removed tabs which fixed the “Deserialization error”, but the selection behaviour is the same.

On Saturday, April 14, 2018 at 8:27:26 AM UTC-4, beezerlm wrote:
One more thing to mention, I am getting a “Deserialization error” in the console every time the DateRangeSlider is updated, but I think this is caused by Tabs(). I am pretty sure the report still functioned properly even with the this error showing in the console.

On Saturday, April 14, 2018 at 8:19:49 AM UTC-4, beezerlm wrote:
Update: I removed the year dropdown and still have this issue, so I am guessing the issue does not lie with the code I posted, but with a change I may have made to accomodate the year dropdown menu. Looking elsewhere at the moment.

On Saturday, April 14, 2018 at 8:15:36 AM UTC-4, beezerlm wrote:
I didn’t notice this problem until I added a “select” drop down menu to filter my report by year (2018 2017 etc…). I’m sure I have something wrong but I am not sure where. My plot circle’s column source data is selected by “df.ShipDate”. If my selection is, let’s say index 100 of the selectable group, then I scrub the slider, it appears it is maintaining the selection as index 100 but the record that was index 100 is now index 95. So as I scrub the selection is jumping all over the report to different records. Here is the function I added that I suspect caused this behaviour:

def update_slider(attr, old, new):
print(‘updating_slider’)

if select_year.value == str(date.today().year):
    start_date = str(date.today().year) + "-01-01"
    end_date = date.today().strftime('%Y-%m-%d')
else:
    start_date = select_year.value + "-01-01"
    end_date = select_year.value + "-12-31"    

new_start_date = start_date.replace("-", " ")
new_start_date = new_start_date.split(" ")
new_start_date = date(int(new_start_date[0]),int(new_start_date[1]),int(new_start_date[2]))

new_end_date = end_date.replace("-", " ")
new_end_date = new_end_date.split(" ")
new_end_date = date(int(new_end_date[0]),int(new_end_date[1]),int(new_end_date[2]))

date_range_slider.value=(new_start_date,new_end_date)
date_range_slider.start = new_start_date
date_range_slider.end = new_end_date    

p.x_range.start = new_start_date
p.x_range.end = new_end_date

print('update_complete')

This function is triggered by:

select_year.on_change(‘value’, update_slider)

Here is a screenshot for reference:

Any Ideas what I might be doing wrong?


You received this message because you are subscribed to the Google Groups “Bokeh Discussion - Public” group.
To unsubscribe from this group and stop receiving emails from it, send an email to [email protected].
To post to this group, send email to [email protected].
To view this discussion on the web visit https://groups.google.com/a/continuum.io/d/msgid/bokeh/1c97cef3-68bc-4cbd-905c-a6b667a22cb0%40continuum.io.
For more options, visit https://groups.google.com/a/continuum.io/d/optout.


You received this message because you are subscribed to the Google Groups “Bokeh Discussion - Public” group.

To unsubscribe from this group and stop receiving emails from it, send an email to [email protected].

To post to this group, send email to [email protected].

To view this discussion on the web visit https://groups.google.com/a/continuum.io/d/msgid/bokeh/74dcd14d-964f-4955-ac4e-171f6d39b0a9%40continuum.io.

For more options, visit https://groups.google.com/a/continuum.io/d/optout.

You received this message because you are subscribed to the Google Groups “Bokeh Discussion - Public” group.

To unsubscribe from this group and stop receiving emails from it, send an email to [email protected].

To post to this group, send email to [email protected].

To view this discussion on the web visit https://groups.google.com/a/continuum.io/d/msgid/bokeh/439fa552-290b-4d02-83f0-9d8322946dff%40continuum.io.

For more options, visit https://groups.google.com/a/continuum.io/d/optout.

Hi,

I ran this with 0.12.16dev3. When I scrub the slider to the right, the points disappear, and when I scrub back left they re-appear (in the same place as before). I am not fully sure either with the correct or wrong behaviors is, can you describe what you expect to see with this code that you are not seeing, so I can get my bearings?

Thanks,

Bryan

···

On Apr 14, 2018, at 10:43, beezerlm <[email protected]> wrote:

Here is a working example. If you select the April 2nd and May 1st records, then slide the left bar past April 2nd, you will see the selection jump to the right.

import pandas as pd
import numpy as np
import math
from datetime import date, datetime
from bokeh.plotting import figure
from bokeh.layouts import widgetbox, row, column
from bokeh.models import ColumnDataSource, HoverTool, CustomJS, WheelZoomTool, Label, LabelSet
from bokeh.models.widgets import DateRangeSlider, Div, Select, Tabs, Panel, TableColumn, DataTable, DateFormatter
from bokeh.io import curdoc, show, output_file, save

def update_plot(attr, old, new):
    try:
        selected = source.selected
    except:
        print("nothing selected...")
    
    start_date = date_range_slider.value_as_datetime[0]
    end_date = date_range_slider.value_as_datetime[1]
    
    mask = (df.ShipDate > start_date) & (df.ShipDate <= end_date)
       
    new_df = df[mask]
    new_data = {
                'x' : new_df.ShipDate,
                'x0' : new_df.ShipDate,
                'x1' : new_df.ShipDate,
                'y' : new_df.DaysBeforeDue,
                'y1' : new_df.DaysBeforeDue
                
                }

    try:
        print('selected',source.selected)
        print('selected.indices',source.selected.indices)
        print('selected.line_indices',source.selected.line_indices)
        print('selected.multiline_indices',source.selected.multiline_indices)
        source.selected = selected
    except:
        print('source.trigger exception raised.')
    
    source.data = new_data

def update_slider(attr, old, new):
    print('updating_slider')
    
    if select_year.value == str(date.today().year):
        start_date = str(date.today().year) + "-01-01"
        end_date = date.today().strftime('%Y-%m-%d')
    else:
        start_date = select_year.value + "-01-01"
        end_date = select_year.value + "-12-31"
    
    new_start_date = start_date.replace("-", " ")
    new_start_date = new_start_date.split(" ")
    new_start_date = date(int(new_start_date[0]),int(new_start_date[1]),int(new_start_date[2]))

    new_end_date = end_date.replace("-", " ")
    new_end_date = new_end_date.split(" ")
    new_end_date = date(int(new_end_date[0]),int(new_end_date[1]),int(new_end_date[2]))

    date_range_slider.value = (new_start_date,new_end_date)
    date_range_slider.start = new_start_date
    date_range_slider.end = new_end_date
    
    p.x_range.start = new_start_date
    p.x_range.end = new_end_date
    
    update_plot()
    print('update_complete')

df = pd.DataFrame()

df['ShipDate'] = [pd.Timestamp('2017-04-02'), pd.Timestamp('2017-05-01'), pd.Timestamp('2017-08-01')]
df['DaysBeforeDue'] = [50, 37, 65]

print(df)

start_date = '2017-04-01'
end_date = '2017-08-01'

source = ColumnDataSource(data={'x' : df.ShipDate,
                                'x0' : df.ShipDate,
                                'x1' : df.ShipDate,
                                'y' : df.DaysBeforeDue,
                                'y1' : df.DaysBeforeDue
                                
                               })

x_range = (pd.Timestamp('2017-03-01'),df.ShipDate.max())
y_range = (-75, 75)

p = figure(plot_width=1500,
           plot_height=550,
           title='On-Time Delivery Report ',
           tools=('pan','tap','reset','save','poly_select', 'wheel_zoom'),
           sizing_mode='scale_width',
           x_range=(x_range),
           y_range=(y_range))

p.segment(x0='x0', y0=0, x1='x1', y1='y1', line_color='green', line_width=3, source=source)
p.circle('x', 'y', size=15, selection_color = 'yellow', fill_color='yellow', line_color='green', line_width=5, nonselection_alpha=0.5, name='circle', source=source)

p.xaxis.axis_label = "Due Date"
p.yaxis.axis_label = "Number Of Days From Due Date"

new_start_date = start_date.replace("-", " ")
new_start_date = new_start_date.split(" ")
new_start_date = date(int(new_start_date[0]),int(new_start_date[1]),int(new_start_date[2]))

new_end_date = end_date.replace("-", " ")
new_end_date = new_end_date.split(" ")
new_end_date = date(int(new_end_date[0]),int(new_end_date[1]),int(new_end_date[2]))

date_range_slider = DateRangeSlider(title="Date range",
                                    value=(new_start_date, new_end_date),
                                    start=new_start_date,
                                    end=new_end_date,
                                    step=1,
                                    css_classes=["custom_slider"]
                                    )

date_range_slider.on_change('value', update_plot)

layout = row(p, sizing_mode='scale_width')

widget_box = widgetbox(date_range_slider, sizing_mode='scale_width', height=70)

update_plot('attr','old','new')

curdoc().add_root(widget_box)
curdoc().add_root(layout)
curdoc().title = 'On-Time Delivery Report'

On Saturday, April 14, 2018 at 11:56:23 AM UTC-4, Bryan Van de ven wrote:
Hi,

Well, setting (as opposed to reading only) selection is definitely not as thoroughly exercised a feature. Additionally, there was just a big change to use the Selection model (instead of the old cumbersome dict). So it's entirely possible there are just bugs. This is definitely a case that having an MRE to examine will help.

Thanks,

Bryan

> On Apr 14, 2018, at 10:51, beezerlm <[email protected]> wrote:
>
> Bryan,
>
> I will try to put a working example together. My code has become a bit unorganized I need to clean it up so it's easier to follow.
>
> On Saturday, April 14, 2018 at 11:42:37 AM UTC-4, Bryan Van de ven wrote:
> I don't see anything at a glance. It's often the case that if I can actually run code, I can identify a problem quickly. If you can share a complete minimal reproducer, I'd be happy to take a closer look.
>
> Thanks,
>
> Bryan
>
> > On Apr 14, 2018, at 10:07, beezerlm <[email protected]> wrote:
> >
> > Update: It has nothing to do with tabs, I removed tabs which fixed the "Deserialization error", but the selection behaviour is the same.
> >
> > On Saturday, April 14, 2018 at 8:27:26 AM UTC-4, beezerlm wrote:
> > One more thing to mention, I am getting a "Deserialization error" in the console every time the DateRangeSlider is updated, but I think this is caused by Tabs(). I am pretty sure the report still functioned properly even with the this error showing in the console.
> >
> > On Saturday, April 14, 2018 at 8:19:49 AM UTC-4, beezerlm wrote:
> > Update: I removed the year dropdown and still have this issue, so I am guessing the issue does not lie with the code I posted, but with a change I may have made to accomodate the year dropdown menu. Looking elsewhere at the moment.
> >
> > On Saturday, April 14, 2018 at 8:15:36 AM UTC-4, beezerlm wrote:
> > I didn't notice this problem until I added a "select" drop down menu to filter my report by year (2018 2017 etc...). I'm sure I have something wrong but I am not sure where. My plot circle's column source data is selected by "df.ShipDate". If my selection is, let's say index 100 of the selectable group, then I scrub the slider, it appears it is maintaining the selection as index 100 but the record that was index 100 is now index 95. So as I scrub the selection is jumping all over the report to different records. Here is the function I added that I suspect caused this behaviour:
> >
> > def update_slider(attr, old, new):
> > print('updating_slider')
> >
> > if select_year.value == str(date.today().year):
> > start_date = str(date.today().year) + "-01-01"
> > end_date = date.today().strftime('%Y-%m-%d')
> > else:
> > start_date = select_year.value + "-01-01"
> > end_date = select_year.value + "-12-31"
> >
> > new_start_date = start_date.replace("-", " ")
> > new_start_date = new_start_date.split(" ")
> > new_start_date = date(int(new_start_date[0]),int(new_start_date[1]),int(new_start_date[2]))
> >
> > new_end_date = end_date.replace("-", " ")
> > new_end_date = new_end_date.split(" ")
> > new_end_date = date(int(new_end_date[0]),int(new_end_date[1]),int(new_end_date[2]))
> >
> > date_range_slider.value=(new_start_date,new_end_date)
> > date_range_slider.start = new_start_date
> > date_range_slider.end = new_end_date
> >
> > p.x_range.start = new_start_date
> > p.x_range.end = new_end_date
> >
> > print('update_complete')
> >
> >
> > This function is triggered by:
> >
> > select_year.on_change('value', update_slider)
> >
> >
> > Here is a screenshot for reference:
> >
> >
> >
> > Any Ideas what I might be doing wrong?
> >
> > --
> > You received this message because you are subscribed to the Google Groups "Bokeh Discussion - Public" group.
> > To unsubscribe from this group and stop receiving emails from it, send an email to bokeh+un...@continuum.io.
> > To post to this group, send email to bo...@continuum.io.
> > To view this discussion on the web visit https://groups.google.com/a/continuum.io/d/msgid/bokeh/1c97cef3-68bc-4cbd-905c-a6b667a22cb0%40continuum.io\.
> > For more options, visit https://groups.google.com/a/continuum.io/d/optout\.
>
>
> --
> You received this message because you are subscribed to the Google Groups "Bokeh Discussion - Public" group.
> To unsubscribe from this group and stop receiving emails from it, send an email to bokeh+un...@continuum.io.
> To post to this group, send email to bo...@continuum.io.
> To view this discussion on the web visit https://groups.google.com/a/continuum.io/d/msgid/bokeh/74dcd14d-964f-4955-ac4e-171f6d39b0a9%40continuum.io\.
> For more options, visit https://groups.google.com/a/continuum.io/d/optout\.

--
You received this message because you are subscribed to the Google Groups "Bokeh Discussion - Public" group.
To unsubscribe from this group and stop receiving emails from it, send an email to [email protected].
To post to this group, send email to [email protected].
To view this discussion on the web visit https://groups.google.com/a/continuum.io/d/msgid/bokeh/ab03561d-26a1-4954-bca7-56adc27f4790%40continuum.io\.
For more options, visit https://groups.google.com/a/continuum.io/d/optout\.
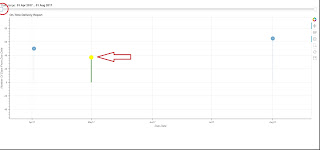
(reposted to fix images)

Bryan,

I expect to see exactly what you are describing, but that’s not what I see. If I make a selection and scrub the left slider past the first record, the selection jumps to the right (the next record/index). I would expect the selection to be static and disappear if the slider goes past. This happens on a single selection or multiple selection. I am using 0.12.15.

···

On Friday, April 20, 2018 at 11:12:43 AM UTC-4, Bryan Van de ven wrote:

Hi,

I ran this with 0.12.16dev3. When I scrub the slider to the right, the points disappear, and when I scrub back left they re-appear (in the same place as before). I am not fully sure either with the correct or wrong behaviors is, can you describe what you expect to see with this code that you are not seeing, so I can get my bearings?

Thanks,

Bryan

On Apr 14, 2018, at 10:43, beezerlm [email protected] wrote:

Here is a working example. If you select the April 2nd and May 1st records, then slide the left bar past April 2nd, you will see the selection jump to the right.

import pandas as pd

import numpy as np

import math

from datetime import date, datetime

from bokeh.plotting import figure
from bokeh.layouts import widgetbox, row, column

from bokeh.models import ColumnDataSource, HoverTool, CustomJS, WheelZoomTool, Label, LabelSet

from bokeh.models.widgets import DateRangeSlider, Div, Select, Tabs, Panel, TableColumn, DataTable, DateFormatter

from bokeh.io import curdoc, show, output_file, save

def update_plot(attr, old, new):

try:
    selected = source.selected
except:
    print("nothing selected...")
start_date = date_range_slider.value_as_datetime[0]
end_date = date_range_slider.value_as_datetime[1]
mask = (df.ShipDate > start_date) & (df.ShipDate <= end_date)
new_df = df[mask]    
new_data = {
            'x'              : new_df.ShipDate,
            'x0'             : new_df.ShipDate,
            'x1'             : new_df.ShipDate,
            'y'              : new_df.DaysBeforeDue,
            'y1'             : new_df.DaysBeforeDue
            }
try:
    print('selected',source.selected)
    print('selected.indices',source.selected.indices)
    print('selected.line_indices',source.selected.line_indices)
    print('selected.multiline_indices',source.selected.multiline_indices)
    source.selected = selected
except:
    print('source.trigger exception raised.')
source.data = new_data

def update_slider(attr, old, new):
print(‘updating_slider’)

if select_year.value == str(date.today().year):
    start_date = str(date.today().year) + "-01-01"
    end_date = date.today().strftime('%Y-%m-%d')
else:
    start_date = select_year.value + "-01-01"
    end_date = select_year.value + "-12-31"    
new_start_date = start_date.replace("-", " ")
new_start_date = new_start_date.split(" ")
new_start_date = date(int(new_start_date[0]),int(new_start_date[1]),int(new_start_date[2]))
new_end_date = end_date.replace("-", " ")
new_end_date = new_end_date.split(" ")
new_end_date = date(int(new_end_date[0]),int(new_end_date[1]),int(new_end_date[2]))
date_range_slider.value = (new_start_date,new_end_date)
date_range_slider.start = new_start_date
date_range_slider.end = new_end_date    
p.x_range.start = new_start_date
p.x_range.end = new_end_date
update_plot()
print('update_complete')

df = pd.DataFrame()

df[‘ShipDate’] = [pd.Timestamp(‘2017-04-02’), pd.Timestamp(‘2017-05-01’), pd.Timestamp(‘2017-08-01’)]

df[‘DaysBeforeDue’] = [50, 37, 65]

print(df)

start_date = ‘2017-04-01’

end_date = ‘2017-08-01’

source = ColumnDataSource(data={‘x’ : df.ShipDate,

                            'x0'             : df.ShipDate,
                            'x1'             : df.ShipDate,
                            'y'              : df.DaysBeforeDue,
                            'y1'             : df.DaysBeforeDue
                           })

x_range = (pd.Timestamp(‘2017-03-01’),df.ShipDate.max())

y_range = (-75, 75)

p = figure(plot_width=1500,

       plot_height=550,
       title='On-Time Delivery Report ',
       tools=('pan','tap','reset','save','poly_select', 'wheel_zoom'),
       sizing_mode='scale_width',
       x_range=(x_range),
       y_range=(y_range))

p.segment(x0=‘x0’, y0=0, x1=‘x1’, y1=‘y1’, line_color=‘green’, line_width=3, source=source)

p.circle(‘x’, ‘y’, size=15, selection_color = ‘yellow’, fill_color=‘yellow’, line_color=‘green’, line_width=5, nonselection_alpha=0.5, name=‘circle’, source=source)

p.xaxis.axis_label = “Due Date”

p.yaxis.axis_label = “Number Of Days From Due Date”

new_start_date = start_date.replace(“-”, " ")

new_start_date = new_start_date.split(" ")

new_start_date = date(int(new_start_date[0]),int(new_start_date[1]),int(new_start_date[2]))

new_end_date = end_date.replace(“-”, " ")

new_end_date = new_end_date.split(" ")

new_end_date = date(int(new_end_date[0]),int(new_end_date[1]),int(new_end_date[2]))

date_range_slider = DateRangeSlider(title=“Date range”,

                                value=(new_start_date, new_end_date),
                                start=new_start_date,
                                end=new_end_date,
                                step=1,
                                css_classes=["custom_slider"]
                                )

date_range_slider.on_change(‘value’, update_plot)

layout = row(p, sizing_mode=‘scale_width’)

widget_box = widgetbox(date_range_slider, sizing_mode=‘scale_width’, height=70)

update_plot(‘attr’,‘old’,‘new’)

curdoc().add_root(widget_box)

curdoc().add_root(layout)

curdoc().title = ‘On-Time Delivery Report’

On Saturday, April 14, 2018 at 11:56:23 AM UTC-4, Bryan Van de ven wrote:

Hi,

Well, setting (as opposed to reading only) selection is definitely not as thoroughly exercised a feature. Additionally, there was just a big change to use the Selection model (instead of the old cumbersome dict). So it’s entirely possible there are just bugs. This is definitely a case that having an MRE to examine will help.

Thanks,

Bryan

On Apr 14, 2018, at 10:51, beezerlm [email protected] wrote:

Bryan,

 I will try to put a working example together.  My code has become a bit unorganized I need to clean it up so it's easier to follow.

On Saturday, April 14, 2018 at 11:42:37 AM UTC-4, Bryan Van de ven wrote:
I don’t see anything at a glance. It’s often the case that if I can actually run code, I can identify a problem quickly. If you can share a complete minimal reproducer, I’d be happy to take a closer look.

Thanks,

Bryan

On Apr 14, 2018, at 10:07, beezerlm [email protected] wrote:

Update: It has nothing to do with tabs, I removed tabs which fixed the “Deserialization error”, but the selection behaviour is the same.

On Saturday, April 14, 2018 at 8:27:26 AM UTC-4, beezerlm wrote:
One more thing to mention, I am getting a “Deserialization error” in the console every time the DateRangeSlider is updated, but I think this is caused by Tabs(). I am pretty sure the report still functioned properly even with the this error showing in the console.

On Saturday, April 14, 2018 at 8:19:49 AM UTC-4, beezerlm wrote:
Update: I removed the year dropdown and still have this issue, so I am guessing the issue does not lie with the code I posted, but with a change I may have made to accomodate the year dropdown menu. Looking elsewhere at the moment.

On Saturday, April 14, 2018 at 8:15:36 AM UTC-4, beezerlm wrote:
I didn’t notice this problem until I added a “select” drop down menu to filter my report by year (2018 2017 etc…). I’m sure I have something wrong but I am not sure where. My plot circle’s column source data is selected by “df.ShipDate”. If my selection is, let’s say index 100 of the selectable group, then I scrub the slider, it appears it is maintaining the selection as index 100 but the record that was index 100 is now index 95. So as I scrub the selection is jumping all over the report to different records. Here is the function I added that I suspect caused this behaviour:

def update_slider(attr, old, new):
print(‘updating_slider’)

if select_year.value == str(date.today().year):
    start_date = str(date.today().year) + "-01-01"
    end_date = date.today().strftime('%Y-%m-%d')
else:
    start_date = select_year.value + "-01-01"
    end_date = select_year.value + "-12-31"    

new_start_date = start_date.replace("-", " ")
new_start_date = new_start_date.split(" ")
new_start_date = date(int(new_start_date[0]),int(new_start_date[1]),int(new_start_date[2]))

new_end_date = end_date.replace("-", " ")
new_end_date = new_end_date.split(" ")
new_end_date = date(int(new_end_date[0]),int(new_end_date[1]),int(new_end_date[2]))

date_range_slider.value=(new_start_date,new_end_date)
date_range_slider.start = new_start_date
date_range_slider.end = new_end_date    

p.x_range.start = new_start_date
p.x_range.end = new_end_date

print('update_complete')

This function is triggered by:

select_year.on_change(‘value’, update_slider)

Here is a screenshot for reference:

Any Ideas what I might be doing wrong?


You received this message because you are subscribed to the Google Groups “Bokeh Discussion - Public” group.

To unsubscribe from this group and stop receiving emails from it, send an email to [email protected].

To post to this group, send email to [email protected].
To view this discussion on the web visit https://groups.google.com/a/continuum.io/d/msgid/bokeh/1c97cef3-68bc-4cbd-905c-a6b667a22cb0%40continuum.io.
For more options, visit https://groups.google.com/a/continuum.io/d/optout.


You received this message because you are subscribed to the Google Groups “Bokeh Discussion - Public” group.
To unsubscribe from this group and stop receiving emails from it, send an email to [email protected].
To post to this group, send email to [email protected].
To view this discussion on the web visit https://groups.google.com/a/continuum.io/d/msgid/bokeh/74dcd14d-964f-4955-ac4e-171f6d39b0a9%40continuum.io.
For more options, visit https://groups.google.com/a/continuum.io/d/optout.


You received this message because you are subscribed to the Google Groups “Bokeh Discussion - Public” group.

To unsubscribe from this group and stop receiving emails from it, send an email to [email protected].

To post to this group, send email to [email protected].

To view this discussion on the web visit https://groups.google.com/a/continuum.io/d/msgid/bokeh/ab03561d-26a1-4954-bca7-56adc27f4790%40continuum.io.

For more options, visit https://groups.google.com/a/continuum.io/d/optout.

There are images in the above post, but they keep getting put in the “show quoted text” area so you may have to expand that to see them.

···

On Friday, April 20, 2018 at 11:12:43 AM UTC-4, Bryan Van de ven wrote:

Hi,

I ran this with 0.12.16dev3. When I scrub the slider to the right, the points disappear, and when I scrub back left they re-appear (in the same place as before). I am not fully sure either with the correct or wrong behaviors is, can you describe what you expect to see with this code that you are not seeing, so I can get my bearings?

Thanks,

Bryan

On Apr 14, 2018, at 10:43, beezerlm [email protected] wrote:

Here is a working example. If you select the April 2nd and May 1st records, then slide the left bar past April 2nd, you will see the selection jump to the right.

import pandas as pd

import numpy as np

import math

from datetime import date, datetime

from bokeh.plotting import figure
from bokeh.layouts import widgetbox, row, column

from bokeh.models import ColumnDataSource, HoverTool, CustomJS, WheelZoomTool, Label, LabelSet

from bokeh.models.widgets import DateRangeSlider, Div, Select, Tabs, Panel, TableColumn, DataTable, DateFormatter

from bokeh.io import curdoc, show, output_file, save

def update_plot(attr, old, new):

try:
    selected = source.selected
except:
    print("nothing selected...")
start_date = date_range_slider.value_as_datetime[0]
end_date = date_range_slider.value_as_datetime[1]
mask = (df.ShipDate > start_date) & (df.ShipDate <= end_date)
new_df = df[mask]    
new_data = {
            'x'              : new_df.ShipDate,
            'x0'             : new_df.ShipDate,
            'x1'             : new_df.ShipDate,
            'y'              : new_df.DaysBeforeDue,
            'y1'             : new_df.DaysBeforeDue
            }
try:
    print('selected',source.selected)
    print('selected.indices',source.selected.indices)
    print('selected.line_indices',source.selected.line_indices)
    print('selected.multiline_indices',source.selected.multiline_indices)
    source.selected = selected
except:
    print('source.trigger exception raised.')
source.data = new_data

def update_slider(attr, old, new):
print(‘updating_slider’)

if select_year.value == str(date.today().year):
    start_date = str(date.today().year) + "-01-01"
    end_date = date.today().strftime('%Y-%m-%d')
else:
    start_date = select_year.value + "-01-01"
    end_date = select_year.value + "-12-31"    
new_start_date = start_date.replace("-", " ")
new_start_date = new_start_date.split(" ")
new_start_date = date(int(new_start_date[0]),int(new_start_date[1]),int(new_start_date[2]))
new_end_date = end_date.replace("-", " ")
new_end_date = new_end_date.split(" ")
new_end_date = date(int(new_end_date[0]),int(new_end_date[1]),int(new_end_date[2]))
date_range_slider.value = (new_start_date,new_end_date)
date_range_slider.start = new_start_date
date_range_slider.end = new_end_date    
p.x_range.start = new_start_date
p.x_range.end = new_end_date
update_plot()
print('update_complete')

df = pd.DataFrame()

df[‘ShipDate’] = [pd.Timestamp(‘2017-04-02’), pd.Timestamp(‘2017-05-01’), pd.Timestamp(‘2017-08-01’)]

df[‘DaysBeforeDue’] = [50, 37, 65]

print(df)

start_date = ‘2017-04-01’

end_date = ‘2017-08-01’

source = ColumnDataSource(data={‘x’ : df.ShipDate,

                            'x0'             : df.ShipDate,
                            'x1'             : df.ShipDate,
                            'y'              : df.DaysBeforeDue,
                            'y1'             : df.DaysBeforeDue
                           })

x_range = (pd.Timestamp(‘2017-03-01’),df.ShipDate.max())

y_range = (-75, 75)

p = figure(plot_width=1500,

       plot_height=550,
       title='On-Time Delivery Report ',
       tools=('pan','tap','reset','save','poly_select', 'wheel_zoom'),
       sizing_mode='scale_width',
       x_range=(x_range),
       y_range=(y_range))

p.segment(x0=‘x0’, y0=0, x1=‘x1’, y1=‘y1’, line_color=‘green’, line_width=3, source=source)

p.circle(‘x’, ‘y’, size=15, selection_color = ‘yellow’, fill_color=‘yellow’, line_color=‘green’, line_width=5, nonselection_alpha=0.5, name=‘circle’, source=source)

p.xaxis.axis_label = “Due Date”

p.yaxis.axis_label = “Number Of Days From Due Date”

new_start_date = start_date.replace(“-”, " ")

new_start_date = new_start_date.split(" ")

new_start_date = date(int(new_start_date[0]),int(new_start_date[1]),int(new_start_date[2]))

new_end_date = end_date.replace(“-”, " ")

new_end_date = new_end_date.split(" ")

new_end_date = date(int(new_end_date[0]),int(new_end_date[1]),int(new_end_date[2]))

date_range_slider = DateRangeSlider(title=“Date range”,

                                value=(new_start_date, new_end_date),
                                start=new_start_date,
                                end=new_end_date,
                                step=1,
                                css_classes=["custom_slider"]
                                )

date_range_slider.on_change(‘value’, update_plot)

layout = row(p, sizing_mode=‘scale_width’)

widget_box = widgetbox(date_range_slider, sizing_mode=‘scale_width’, height=70)

update_plot(‘attr’,‘old’,‘new’)

curdoc().add_root(widget_box)

curdoc().add_root(layout)

curdoc().title = ‘On-Time Delivery Report’

On Saturday, April 14, 2018 at 11:56:23 AM UTC-4, Bryan Van de ven wrote:

Hi,

Well, setting (as opposed to reading only) selection is definitely not as thoroughly exercised a feature. Additionally, there was just a big change to use the Selection model (instead of the old cumbersome dict). So it’s entirely possible there are just bugs. This is definitely a case that having an MRE to examine will help.

Thanks,

Bryan

On Apr 14, 2018, at 10:51, beezerlm [email protected] wrote:

Bryan,

 I will try to put a working example together.  My code has become a bit unorganized I need to clean it up so it's easier to follow.

On Saturday, April 14, 2018 at 11:42:37 AM UTC-4, Bryan Van de ven wrote:
I don’t see anything at a glance. It’s often the case that if I can actually run code, I can identify a problem quickly. If you can share a complete minimal reproducer, I’d be happy to take a closer look.

Thanks,

Bryan

On Apr 14, 2018, at 10:07, beezerlm [email protected] wrote:

Update: It has nothing to do with tabs, I removed tabs which fixed the “Deserialization error”, but the selection behaviour is the same.

On Saturday, April 14, 2018 at 8:27:26 AM UTC-4, beezerlm wrote:
One more thing to mention, I am getting a “Deserialization error” in the console every time the DateRangeSlider is updated, but I think this is caused by Tabs(). I am pretty sure the report still functioned properly even with the this error showing in the console.

On Saturday, April 14, 2018 at 8:19:49 AM UTC-4, beezerlm wrote:
Update: I removed the year dropdown and still have this issue, so I am guessing the issue does not lie with the code I posted, but with a change I may have made to accomodate the year dropdown menu. Looking elsewhere at the moment.

On Saturday, April 14, 2018 at 8:15:36 AM UTC-4, beezerlm wrote:
I didn’t notice this problem until I added a “select” drop down menu to filter my report by year (2018 2017 etc…). I’m sure I have something wrong but I am not sure where. My plot circle’s column source data is selected by “df.ShipDate”. If my selection is, let’s say index 100 of the selectable group, then I scrub the slider, it appears it is maintaining the selection as index 100 but the record that was index 100 is now index 95. So as I scrub the selection is jumping all over the report to different records. Here is the function I added that I suspect caused this behaviour:

def update_slider(attr, old, new):
print(‘updating_slider’)

if select_year.value == str(date.today().year):
    start_date = str(date.today().year) + "-01-01"
    end_date = date.today().strftime('%Y-%m-%d')
else:
    start_date = select_year.value + "-01-01"
    end_date = select_year.value + "-12-31"    

new_start_date = start_date.replace("-", " ")
new_start_date = new_start_date.split(" ")
new_start_date = date(int(new_start_date[0]),int(new_start_date[1]),int(new_start_date[2]))

new_end_date = end_date.replace("-", " ")
new_end_date = new_end_date.split(" ")
new_end_date = date(int(new_end_date[0]),int(new_end_date[1]),int(new_end_date[2]))

date_range_slider.value=(new_start_date,new_end_date)
date_range_slider.start = new_start_date
date_range_slider.end = new_end_date    

p.x_range.start = new_start_date
p.x_range.end = new_end_date

print('update_complete')

This function is triggered by:

select_year.on_change(‘value’, update_slider)

Here is a screenshot for reference:

Any Ideas what I might be doing wrong?


You received this message because you are subscribed to the Google Groups “Bokeh Discussion - Public” group.

To unsubscribe from this group and stop receiving emails from it, send an email to [email protected].

To post to this group, send email to [email protected].
To view this discussion on the web visit https://groups.google.com/a/continuum.io/d/msgid/bokeh/1c97cef3-68bc-4cbd-905c-a6b667a22cb0%40continuum.io.
For more options, visit https://groups.google.com/a/continuum.io/d/optout.


You received this message because you are subscribed to the Google Groups “Bokeh Discussion - Public” group.
To unsubscribe from this group and stop receiving emails from it, send an email to [email protected].
To post to this group, send email to [email protected].
To view this discussion on the web visit https://groups.google.com/a/continuum.io/d/msgid/bokeh/74dcd14d-964f-4955-ac4e-171f6d39b0a9%40continuum.io.
For more options, visit https://groups.google.com/a/continuum.io/d/optout.


You received this message because you are subscribed to the Google Groups “Bokeh Discussion - Public” group.

To unsubscribe from this group and stop receiving emails from it, send an email to [email protected].

To post to this group, send email to [email protected].

To view this discussion on the web visit https://groups.google.com/a/continuum.io/d/msgid/bokeh/ab03561d-26a1-4954-bca7-56adc27f4790%40continuum.io.

For more options, visit https://groups.google.com/a/continuum.io/d/optout.

Hi,

Are you trying with the most recent dev build? If not, can you try that and report back? It's possible this was fixed in other work.

  <no title> — Bokeh 3.3.2 Documentation

Thanks,

Bryan

···

On Apr 20, 2018, at 13:07, beezerlm <[email protected]> wrote:

There are images in the above post, but they keep getting put in the "show quoted text" area so you may have to expand that to see them.

On Friday, April 20, 2018 at 11:12:43 AM UTC-4, Bryan Van de ven wrote:
Hi,

I ran this with 0.12.16dev3. When I scrub the slider to the right, the points disappear, and when I scrub back left they re-appear (in the same place as before). I am not fully sure either with the correct or wrong behaviors is, can you describe what you expect to see with this code that you are not seeing, so I can get my bearings?

Thanks,

Bryan

> On Apr 14, 2018, at 10:43, beezerlm <[email protected]> wrote:
>
> Here is a working example. If you select the April 2nd and May 1st records, then slide the left bar past April 2nd, you will see the selection jump to the right.
>
>
> import pandas as pd
> import numpy as np
> import math
> from datetime import date, datetime
> from bokeh.plotting import figure
> from bokeh.layouts import widgetbox, row, column
> from bokeh.models import ColumnDataSource, HoverTool, CustomJS, WheelZoomTool, Label, LabelSet
> from bokeh.models.widgets import DateRangeSlider, Div, Select, Tabs, Panel, TableColumn, DataTable, DateFormatter
> from bokeh.io import curdoc, show, output_file, save
>
>
>
> def update_plot(attr, old, new):
> try:
> selected = source.selected
> except:
> print("nothing selected...")
>
> start_date = date_range_slider.value_as_datetime[0]
> end_date = date_range_slider.value_as_datetime[1]
>
> mask = (df.ShipDate > start_date) & (df.ShipDate <= end_date)
>
> new_df = df[mask]
> new_data = {
> 'x' : new_df.ShipDate,
> 'x0' : new_df.ShipDate,
> 'x1' : new_df.ShipDate,
> 'y' : new_df.DaysBeforeDue,
> 'y1' : new_df.DaysBeforeDue
>
> }
>
> try:
> print('selected',source.selected)
> print('selected.indices',source.selected.indices)
> print('selected.line_indices',source.selected.line_indices)
> print('selected.multiline_indices',source.selected.multiline_indices)
> source.selected = selected
> except:
> print('source.trigger exception raised.')
>
> source.data = new_data
>
> def update_slider(attr, old, new):
> print('updating_slider')
>
> if select_year.value == str(date.today().year):
> start_date = str(date.today().year) + "-01-01"
> end_date = date.today().strftime('%Y-%m-%d')
> else:
> start_date = select_year.value + "-01-01"
> end_date = select_year.value + "-12-31"
>
> new_start_date = start_date.replace("-", " ")
> new_start_date = new_start_date.split(" ")
> new_start_date = date(int(new_start_date[0]),int(new_start_date[1]),int(new_start_date[2]))
>
> new_end_date = end_date.replace("-", " ")
> new_end_date = new_end_date.split(" ")
> new_end_date = date(int(new_end_date[0]),int(new_end_date[1]),int(new_end_date[2]))
>
> date_range_slider.value = (new_start_date,new_end_date)
> date_range_slider.start = new_start_date
> date_range_slider.end = new_end_date
>
> p.x_range.start = new_start_date
> p.x_range.end = new_end_date
>
> update_plot()
> print('update_complete')
>
> df = pd.DataFrame()
>
> df['ShipDate'] = [pd.Timestamp('2017-04-02'), pd.Timestamp('2017-05-01'), pd.Timestamp('2017-08-01')]
> df['DaysBeforeDue'] = [50, 37, 65]
>
> print(df)
>
> start_date = '2017-04-01'
> end_date = '2017-08-01'
>
> source = ColumnDataSource(data={'x' : df.ShipDate,
> 'x0' : df.ShipDate,
> 'x1' : df.ShipDate,
> 'y' : df.DaysBeforeDue,
> 'y1' : df.DaysBeforeDue
>
> })
>
>
> x_range = (pd.Timestamp('2017-03-01'),df.ShipDate.max())
> y_range = (-75, 75)
>
> p = figure(plot_width=1500,
> plot_height=550,
> title='On-Time Delivery Report ',
> tools=('pan','tap','reset','save','poly_select', 'wheel_zoom'),
> sizing_mode='scale_width',
> x_range=(x_range),
> y_range=(y_range))
>
> p.segment(x0='x0', y0=0, x1='x1', y1='y1', line_color='green', line_width=3, source=source)
> p.circle('x', 'y', size=15, selection_color = 'yellow', fill_color='yellow', line_color='green', line_width=5, nonselection_alpha=0.5, name='circle', source=source)
>
> p.xaxis.axis_label = "Due Date"
> p.yaxis.axis_label = "Number Of Days From Due Date"
>
> new_start_date = start_date.replace("-", " ")
> new_start_date = new_start_date.split(" ")
> new_start_date = date(int(new_start_date[0]),int(new_start_date[1]),int(new_start_date[2]))
>
> new_end_date = end_date.replace("-", " ")
> new_end_date = new_end_date.split(" ")
> new_end_date = date(int(new_end_date[0]),int(new_end_date[1]),int(new_end_date[2]))
>
> date_range_slider = DateRangeSlider(title="Date range",
> value=(new_start_date, new_end_date),
> start=new_start_date,
> end=new_end_date,
> step=1,
> css_classes=["custom_slider"]
> )
>
> date_range_slider.on_change('value', update_plot)
>
> layout = row(p, sizing_mode='scale_width')
>
> widget_box = widgetbox(date_range_slider, sizing_mode='scale_width', height=70)
>
> update_plot('attr','old','new')
>
> curdoc().add_root(widget_box)
> curdoc().add_root(layout)
> curdoc().title = 'On-Time Delivery Report'
>
>
>
>
> On Saturday, April 14, 2018 at 11:56:23 AM UTC-4, Bryan Van de ven wrote:
> Hi,
>
> Well, setting (as opposed to reading only) selection is definitely not as thoroughly exercised a feature. Additionally, there was just a big change to use the Selection model (instead of the old cumbersome dict). So it's entirely possible there are just bugs. This is definitely a case that having an MRE to examine will help.
>
> Thanks,
>
> Bryan
>
> > On Apr 14, 2018, at 10:51, beezerlm <[email protected]> wrote:
> >
> > Bryan,
> >
> > I will try to put a working example together. My code has become a bit unorganized I need to clean it up so it's easier to follow.
> >
> > On Saturday, April 14, 2018 at 11:42:37 AM UTC-4, Bryan Van de ven wrote:
> > I don't see anything at a glance. It's often the case that if I can actually run code, I can identify a problem quickly. If you can share a complete minimal reproducer, I'd be happy to take a closer look.
> >
> > Thanks,
> >
> > Bryan
> >
> > > On Apr 14, 2018, at 10:07, beezerlm <[email protected]> wrote:
> > >
> > > Update: It has nothing to do with tabs, I removed tabs which fixed the "Deserialization error", but the selection behaviour is the same.
> > >
> > > On Saturday, April 14, 2018 at 8:27:26 AM UTC-4, beezerlm wrote:
> > > One more thing to mention, I am getting a "Deserialization error" in the console every time the DateRangeSlider is updated, but I think this is caused by Tabs(). I am pretty sure the report still functioned properly even with the this error showing in the console.
> > >
> > > On Saturday, April 14, 2018 at 8:19:49 AM UTC-4, beezerlm wrote:
> > > Update: I removed the year dropdown and still have this issue, so I am guessing the issue does not lie with the code I posted, but with a change I may have made to accomodate the year dropdown menu. Looking elsewhere at the moment.
> > >
> > > On Saturday, April 14, 2018 at 8:15:36 AM UTC-4, beezerlm wrote:
> > > I didn't notice this problem until I added a "select" drop down menu to filter my report by year (2018 2017 etc...). I'm sure I have something wrong but I am not sure where. My plot circle's column source data is selected by "df.ShipDate". If my selection is, let's say index 100 of the selectable group, then I scrub the slider, it appears it is maintaining the selection as index 100 but the record that was index 100 is now index 95. So as I scrub the selection is jumping all over the report to different records. Here is the function I added that I suspect caused this behaviour:
> > >
> > > def update_slider(attr, old, new):
> > > print('updating_slider')
> > >
> > > if select_year.value == str(date.today().year):
> > > start_date = str(date.today().year) + "-01-01"
> > > end_date = date.today().strftime('%Y-%m-%d')
> > > else:
> > > start_date = select_year.value + "-01-01"
> > > end_date = select_year.value + "-12-31"
> > >
> > > new_start_date = start_date.replace("-", " ")
> > > new_start_date = new_start_date.split(" ")
> > > new_start_date = date(int(new_start_date[0]),int(new_start_date[1]),int(new_start_date[2]))
> > >
> > > new_end_date = end_date.replace("-", " ")
> > > new_end_date = new_end_date.split(" ")
> > > new_end_date = date(int(new_end_date[0]),int(new_end_date[1]),int(new_end_date[2]))
> > >
> > > date_range_slider.value=(new_start_date,new_end_date)
> > > date_range_slider.start = new_start_date
> > > date_range_slider.end = new_end_date
> > >
> > > p.x_range.start = new_start_date
> > > p.x_range.end = new_end_date
> > >
> > > print('update_complete')
> > >
> > >
> > > This function is triggered by:
> > >
> > > select_year.on_change('value', update_slider)
> > >
> > >
> > > Here is a screenshot for reference:
> > >
> > >
> > >
> > > Any Ideas what I might be doing wrong?
> > >
> > > --
> > > You received this message because you are subscribed to the Google Groups "Bokeh Discussion - Public" group.
> > > To unsubscribe from this group and stop receiving emails from it, send an email to bokeh+un...@continuum.io.
> > > To post to this group, send email to bo...@continuum.io.
> > > To view this discussion on the web visit https://groups.google.com/a/continuum.io/d/msgid/bokeh/1c97cef3-68bc-4cbd-905c-a6b667a22cb0%40continuum.io\.
> > > For more options, visit https://groups.google.com/a/continuum.io/d/optout\.
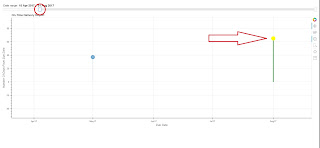
> >
> >
> > --
> > You received this message because you are subscribed to the Google Groups "Bokeh Discussion - Public" group.
> > To unsubscribe from this group and stop receiving emails from it, send an email to bokeh+un...@continuum.io.
> > To post to this group, send email to bo...@continuum.io.
> > To view this discussion on the web visit https://groups.google.com/a/continuum.io/d/msgid/bokeh/74dcd14d-964f-4955-ac4e-171f6d39b0a9%40continuum.io\.
> > For more options, visit https://groups.google.com/a/continuum.io/d/optout\.
>
>
> --
> You received this message because you are subscribed to the Google Groups "Bokeh Discussion - Public" group.
> To unsubscribe from this group and stop receiving emails from it, send an email to bokeh+un...@continuum.io.
> To post to this group, send email to bo...@continuum.io.
> To view this discussion on the web visit https://groups.google.com/a/continuum.io/d/msgid/bokeh/ab03561d-26a1-4954-bca7-56adc27f4790%40continuum.io\.
> For more options, visit https://groups.google.com/a/continuum.io/d/optout\.

--
You received this message because you are subscribed to the Google Groups "Bokeh Discussion - Public" group.
To unsubscribe from this group and stop receiving emails from it, send an email to [email protected].
To post to this group, send email to [email protected].
To view this discussion on the web visit https://groups.google.com/a/continuum.io/d/msgid/bokeh/6812ef23-181b-43c2-9b42-d2c237cd6bfa%40continuum.io\.
For more options, visit https://groups.google.com/a/continuum.io/d/optout\.

Just tried with 0.12.16dev3 and it has the same behavior.

···

On Friday, April 20, 2018 at 5:31:17 PM UTC-4, Bryan Van de ven wrote:

Hi,

Are you trying with the most recent dev build? If not, can you try that and report back? It’s possible this was fixed in other work.

    [https://bokeh.pydata.org/en/latest/docs/installation.html#developer-builds](https://bokeh.pydata.org/en/latest/docs/installation.html#developer-builds)

Thanks,

Bryan

On Apr 20, 2018, at 13:07, beezerlm [email protected] wrote:

There are images in the above post, but they keep getting put in the “show quoted text” area so you may have to expand that to see them.

On Friday, April 20, 2018 at 11:12:43 AM UTC-4, Bryan Van de ven wrote:

Hi,

I ran this with 0.12.16dev3. When I scrub the slider to the right, the points disappear, and when I scrub back left they re-appear (in the same place as before). I am not fully sure either with the correct or wrong behaviors is, can you describe what you expect to see with this code that you are not seeing, so I can get my bearings?

Thanks,

Bryan

On Apr 14, 2018, at 10:43, beezerlm [email protected] wrote:

Here is a working example. If you select the April 2nd and May 1st records, then slide the left bar past April 2nd, you will see the selection jump to the right.

import pandas as pd
import numpy as np
import math
from datetime import date, datetime
from bokeh.plotting import figure
from bokeh.layouts import widgetbox, row, column
from bokeh.models import ColumnDataSource, HoverTool, CustomJS, WheelZoomTool, Label, LabelSet
from bokeh.models.widgets import DateRangeSlider, Div, Select, Tabs, Panel, TableColumn, DataTable, DateFormatter
from bokeh.io import curdoc, show, output_file, save

def update_plot(attr, old, new):
try:
selected = source.selected
except:
print(“nothing selected…”)

start_date = date_range_slider.value_as_datetime[0]
end_date = date_range_slider.value_as_datetime[1]

mask = (df.ShipDate > start_date) & (df.ShipDate <= end_date)
   
new_df = df[mask]    
new_data = {
            'x'              : new_df.ShipDate,
            'x0'             : new_df.ShipDate,
            'x1'             : new_df.ShipDate,
            'y'              : new_df.DaysBeforeDue,
            'y1'             : new_df.DaysBeforeDue
           
            }

try:
    print('selected',source.selected)
    print('selected.indices',source.selected.indices)
    print('selected.line_indices',source.selected.line_indices)
    print('selected.multiline_indices',source.selected.multiline_indices)
    source.selected = selected
except:
    print('source.trigger exception raised.')

source.data = new_data

def update_slider(attr, old, new):
print(‘updating_slider’)

if select_year.value == str(date.today().year):
    start_date = str(date.today().year) + "-01-01"
    end_date = date.today().strftime('%Y-%m-%d')
else:
    start_date = select_year.value + "-01-01"
    end_date = select_year.value + "-12-31"    

new_start_date = start_date.replace("-", " ")
new_start_date = new_start_date.split(" ")
new_start_date = date(int(new_start_date[0]),int(new_start_date[1]),int(new_start_date[2]))

new_end_date = end_date.replace("-", " ")
new_end_date = new_end_date.split(" ")
new_end_date = date(int(new_end_date[0]),int(new_end_date[1]),int(new_end_date[2]))

date_range_slider.value = (new_start_date,new_end_date)
date_range_slider.start = new_start_date
date_range_slider.end = new_end_date    

p.x_range.start = new_start_date
p.x_range.end = new_end_date

update_plot()
print('update_complete')

df = pd.DataFrame()

df[‘ShipDate’] = [pd.Timestamp(‘2017-04-02’), pd.Timestamp(‘2017-05-01’), pd.Timestamp(‘2017-08-01’)]
df[‘DaysBeforeDue’] = [50, 37, 65]

print(df)

start_date = ‘2017-04-01’
end_date = ‘2017-08-01’

source = ColumnDataSource(data={‘x’ : df.ShipDate,
‘x0’ : df.ShipDate,
‘x1’ : df.ShipDate,
‘y’ : df.DaysBeforeDue,
‘y1’ : df.DaysBeforeDue

                           })

x_range = (pd.Timestamp(‘2017-03-01’),df.ShipDate.max())
y_range = (-75, 75)

p = figure(plot_width=1500,
plot_height=550,
title='On-Time Delivery Report ',
tools=(‘pan’,‘tap’,‘reset’,‘save’,‘poly_select’, ‘wheel_zoom’),
sizing_mode=‘scale_width’,
x_range=(x_range),
y_range=(y_range))

p.segment(x0=‘x0’, y0=0, x1=‘x1’, y1=‘y1’, line_color=‘green’, line_width=3, source=source)
p.circle(‘x’, ‘y’, size=15, selection_color = ‘yellow’, fill_color=‘yellow’, line_color=‘green’, line_width=5, nonselection_alpha=0.5, name=‘circle’, source=source)

p.xaxis.axis_label = “Due Date”
p.yaxis.axis_label = “Number Of Days From Due Date”

new_start_date = start_date.replace(“-”, " “)
new_start_date = new_start_date.split(” ")
new_start_date = date(int(new_start_date[0]),int(new_start_date[1]),int(new_start_date[2]))

new_end_date = end_date.replace(“-”, " “)
new_end_date = new_end_date.split(” ")
new_end_date = date(int(new_end_date[0]),int(new_end_date[1]),int(new_end_date[2]))

date_range_slider = DateRangeSlider(title=“Date range”,
value=(new_start_date, new_end_date),
start=new_start_date,
end=new_end_date,
step=1,
css_classes=[“custom_slider”]
)

date_range_slider.on_change(‘value’, update_plot)

layout = row(p, sizing_mode=‘scale_width’)

widget_box = widgetbox(date_range_slider, sizing_mode=‘scale_width’, height=70)

update_plot(‘attr’,‘old’,‘new’)

curdoc().add_root(widget_box)
curdoc().add_root(layout)
curdoc().title = ‘On-Time Delivery Report’

On Saturday, April 14, 2018 at 11:56:23 AM UTC-4, Bryan Van de ven wrote:
Hi,

Well, setting (as opposed to reading only) selection is definitely not as thoroughly exercised a feature. Additionally, there was just a big change to use the Selection model (instead of the old cumbersome dict). So it’s entirely possible there are just bugs. This is definitely a case that having an MRE to examine will help.

Thanks,

Bryan

On Apr 14, 2018, at 10:51, beezerlm [email protected] wrote:

Bryan,

 I will try to put a working example together.  My code has become a bit unorganized I need to clean it up so it's easier to follow.

On Saturday, April 14, 2018 at 11:42:37 AM UTC-4, Bryan Van de ven wrote:
I don’t see anything at a glance. It’s often the case that if I can actually run code, I can identify a problem quickly. If you can share a complete minimal reproducer, I’d be happy to take a closer look.

Thanks,

Bryan

On Apr 14, 2018, at 10:07, beezerlm [email protected] wrote:

Update: It has nothing to do with tabs, I removed tabs which fixed the “Deserialization error”, but the selection behaviour is the same.

On Saturday, April 14, 2018 at 8:27:26 AM UTC-4, beezerlm wrote:
One more thing to mention, I am getting a “Deserialization error” in the console every time the DateRangeSlider is updated, but I think this is caused by Tabs(). I am pretty sure the report still functioned properly even with the this error showing in the console.

On Saturday, April 14, 2018 at 8:19:49 AM UTC-4, beezerlm wrote:
Update: I removed the year dropdown and still have this issue, so I am guessing the issue does not lie with the code I posted, but with a change I may have made to accomodate the year dropdown menu. Looking elsewhere at the moment.

On Saturday, April 14, 2018 at 8:15:36 AM UTC-4, beezerlm wrote:
I didn’t notice this problem until I added a “select” drop down menu to filter my report by year (2018 2017 etc…). I’m sure I have something wrong but I am not sure where. My plot circle’s column source data is selected by “df.ShipDate”. If my selection is, let’s say index 100 of the selectable group, then I scrub the slider, it appears it is maintaining the selection as index 100 but the record that was index 100 is now index 95. So as I scrub the selection is jumping all over the report to different records. Here is the function I added that I suspect caused this behaviour:

def update_slider(attr, old, new):
print(‘updating_slider’)

if select_year.value == str(date.today().year):
    start_date = str(date.today().year) + "-01-01"
    end_date = date.today().strftime('%Y-%m-%d')
else:
    start_date = select_year.value + "-01-01"
    end_date = select_year.value + "-12-31"    

new_start_date = start_date.replace("-", " ")
new_start_date = new_start_date.split(" ")
new_start_date = date(int(new_start_date[0]),int(new_start_date[1]),int(new_start_date[2]))

new_end_date = end_date.replace("-", " ")
new_end_date = new_end_date.split(" ")
new_end_date = date(int(new_end_date[0]),int(new_end_date[1]),int(new_end_date[2]))

date_range_slider.value=(new_start_date,new_end_date)
date_range_slider.start = new_start_date
date_range_slider.end = new_end_date    

p.x_range.start = new_start_date
p.x_range.end = new_end_date

print('update_complete')

This function is triggered by:

select_year.on_change(‘value’, update_slider)

Here is a screenshot for reference:

Any Ideas what I might be doing wrong?


You received this message because you are subscribed to the Google Groups “Bokeh Discussion - Public” group.
To unsubscribe from this group and stop receiving emails from it, send an email to [email protected].
To post to this group, send email to [email protected].
To view this discussion on the web visit https://groups.google.com/a/continuum.io/d/msgid/bokeh/1c97cef3-68bc-4cbd-905c-a6b667a22cb0%40continuum.io.
For more options, visit https://groups.google.com/a/continuum.io/d/optout.


You received this message because you are subscribed to the Google Groups “Bokeh Discussion - Public” group.

To unsubscribe from this group and stop receiving emails from it, send an email to [email protected].

To post to this group, send email to [email protected].
To view this discussion on the web visit https://groups.google.com/a/continuum.io/d/msgid/bokeh/74dcd14d-964f-4955-ac4e-171f6d39b0a9%40continuum.io.
For more options, visit https://groups.google.com/a/continuum.io/d/optout.


You received this message because you are subscribed to the Google Groups “Bokeh Discussion - Public” group.
To unsubscribe from this group and stop receiving emails from it, send an email to [email protected].
To post to this group, send email to [email protected].
To view this discussion on the web visit https://groups.google.com/a/continuum.io/d/msgid/bokeh/ab03561d-26a1-4954-bca7-56adc27f4790%40continuum.io.
For more options, visit https://groups.google.com/a/continuum.io/d/optout.


You received this message because you are subscribed to the Google Groups “Bokeh Discussion - Public” group.

To unsubscribe from this group and stop receiving emails from it, send an email to [email protected].

To post to this group, send email to [email protected].

To view this discussion on the web visit https://groups.google.com/a/continuum.io/d/msgid/bokeh/6812ef23-181b-43c2-9b42-d2c237cd6bfa%40continuum.io.

For more options, visit https://groups.google.com/a/continuum.io/d/optout.