What are you trying to do?
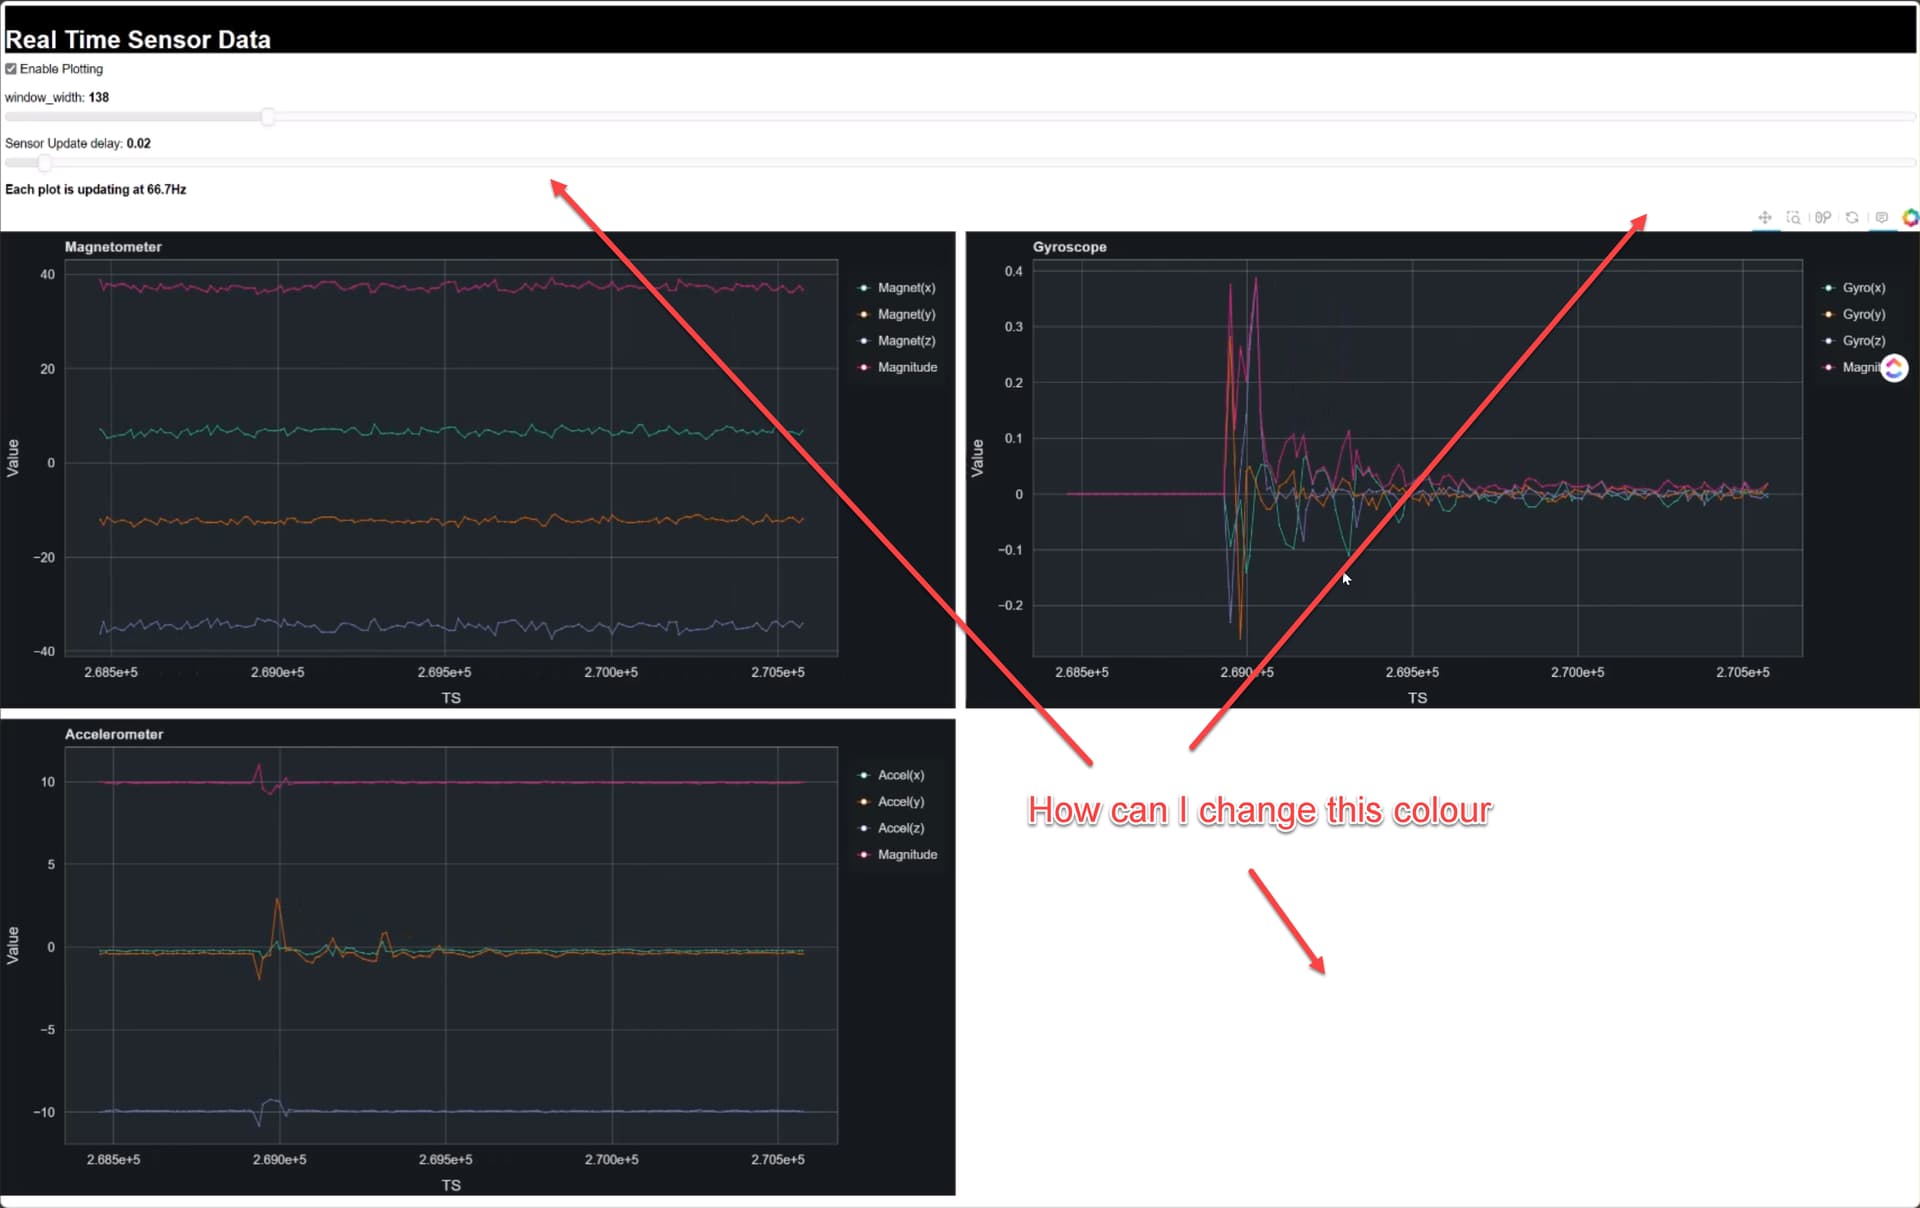
Create a library that allows me to plot up to 400pts/sec in realtime. This is working but I am hoping to prettify the UI but cant seem to find an option to set the background colour for the parent page.
What have you tried that did NOT work as expected?
I can find the options to change the theme of widgets but not the parent(Bokeh Page) container
If this is a question about Bokeh code, YES
class BokehPage:
    def __init__(self, defaults: LayoutDefaults, sensor_is_reading: Event) -> None:
        """Initialse page/canvas

        Args:
            defaults (LayoutDefaults): default setup values
        """
        self.doc = curdoc()
        curdoc().theme = "dark_minimal"

        self.defaults = defaults
        self.window_width = self.defaults.window_slider_value
        self.start_stop_checkbox = None
        self.window_width_slider = None
        self.sensor_speed_slider = None
        self.all_plots = None
        self.plots = None
        self.sensor_is_reading = sensor_is_reading

        self.header = Div(
            text=f"<h1 style='color:{defaults.page_title_colour}'>{defaults.page_title}</h1>",
            width=defaults.page_title_width,
            height=defaults.page_title_height,
            background="black",
        )

    def add_plots(self, plots: List["BokehPlot"]):
        """Add plots to window

        Args:
            plots (List[BokehPlot]): list of bokeh plots showing sensor data
        """
        self.plots = plots
        grid_plot = []

        for p in plots:
            grid_plot.append(p.plt)

        n = self.defaults.n_columns
        grid_plot = [grid_plot[i : i + n] for i in range(0, len(grid_plot), n)]
        self.all_plots = gridplot(
            grid_plot,
        )
        self.all_plots.spacing = 10
        self.layout()

    def layout(self):
        """Add plots and sliders to layout"""
        self.doc.title = self.defaults.page_title

        self.start_stop_checkbox = CheckboxGroup(labels=["Enable Plotting"], active=[0])
        self.start_stop_checkbox.on_change("active", self.start_stop_handler)

        self.window_width_slider = Slider(
            start=self.defaults.window_slider_start,
            end=self.defaults.window_slider_end,
            value=self.defaults.window_slider_value,
            step=self.defaults.window_slider_step,
            title="window_width",
        )
        self.window_width_slider.on_change("value", self.window_width_handler)

        # adjust delay from sensor data updates. Can be removed for real data
        self.sensor_speed = Slider(
            start=self.defaults.sensor_speed_slider_start,
            end=self.defaults.sensor_speed_slider_end,
            value=self.defaults.sensor_speed_slider_value,
            step=self.defaults.sensor_speed_slider_step,
            title="Sensor Update delay",
        )
        self.sensor_speed.on_change("value", self.sensor_speed_handler)

        self.hertz_div = Div(
            text=f"<b>Each plot is updating at {1/self.defaults.sensor_speed_slider_value:.1f}Hz</b>"
        )

        a = 1
        itms = [
            self.header,
            self.start_stop_checkbox,
            self.window_width_slider,
            self.sensor_speed,
            self.hertz_div,
            self.all_plots,
        ]
        for itm in itms:
            itm.sizing_mode = "stretch_width"

        layout = column(*itms)
        layout.sizing_mode = "stretch_width"

        self.doc.add_root(layout)

    def start_stop_handler(self, attr: str, old: int, new: int):
        """Pause plot updates so you can

        Args:
            attr (str): only used as a placeholder
            old (int): only used as a placeholder
            new (int): current checkbox value: 0 off, 1 on
        """
        if new:
            self.sensor_is_reading.set()
        else:
            self.sensor_is_reading.clear()

    def window_width_handler(self, attr, old, new):
        """Pause plot updates so you can

        Args:
            attr (str): only used as a placeholder
            old (int): only used as a placeholder
            new (int): sets with of rolling window
        """
        self.window_width = new

    def sensor_speed_handler(self, attr, old, new):
        """Pause plot updates so you can

        Args:
            attr (str): only used as a placeholder
            old (int): only used as a placeholder
            new (int): sets delay between sensor updates
        """
        self.hertz_div.text = f"<b>Each plot is updating at {1/new:.1f}Hz</b>"
        self.defaults.delay_queue.append(new)


class BokehPlot:
    def __init__(self, parent: BokehPage, sensor_details: SensorDetails) -> None:
        """Initialise a plot

        Args:
            parent (BokehPage): parent that will contain the plot
            signal (SensorConsumer): sensor signal producer
        """
        self.parent = parent
        self.doc = parent.doc

        self.colours = cycle(palette)

        self.defaults = PlotDefaults(sensor_details)

        self.plot_options = dict(
            width=self.defaults.plot_width,
            height=self.defaults.plot_height,
            tools=[
                HoverTool(tooltips=self.defaults.tooltips),
                self.defaults.plot_tools,
            ],
        )

        self.source, self.plt = self.definePlot()

    def definePlot(self):
        """Automaticaaly define the plot based on the legend data supplied in Main

        Returns:
            (source, plt): (source data for sensor, plot data based on sensor data)
        """
        plt = figure(**self.plot_options, title=self.defaults.plot_title)
        plt.sizing_mode = "scale_width"
        plt.xaxis.axis_label = self.defaults.xaxis_label
        plt.yaxis.axis_label = self.defaults.yaxis_label

        # if multiple y values (eg y, y1,y2...yn) in plot create a multiline plot
        data = {_y: [0] for _y in self.defaults.ys_legend_text.keys()}
        data["x"] = [0]

        source = ColumnDataSource(data=data)

        items = []

        for y, legend_text in self.defaults.ys_legend_text.items():
            colour = next(self.colours)
            r1 = plt.line(x="x", y=y, source=source, line_width=2, color=colour)
            r1a = plt.circle(
                x="x", y=y, source=source, fill_color="white", size=5, color=colour
            )
            items.append((legend_text, [r1, r1a]))

        legend = Legend(items=items)
        plt.add_layout(legend, "right")
        plt.legend.click_policy = "hide"

        return source, plt

    @gen.coroutine
    def update(self, new_data: dict):
        """update source data from sensor data

        Args:
            new_data (dict): newest data
        """

        if self.parent.sensor_is_reading.is_set():
            self.source.stream(new_data, rollover=self.parent.window_width)
full code at
fast_sensor_stream/bokeh_stream/bokeh_plot.py at main · hidara2000/fast_sensor_stream (github.com)
I would have thought that the line
curdoc().theme = "dark_minimal"
could have addressed this
Any help would be appreciated, cheers.