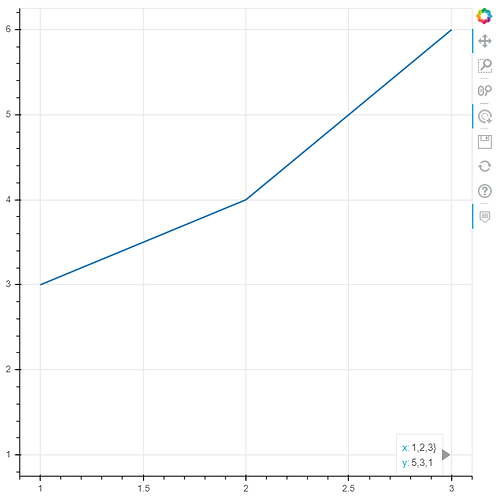
Hi, I have added a hover tool to my plot, but I only want the tool to interact with lines that have been selected via the tap tool. So when i have only one line selected, i only want the hover tool to show information about that selected line. However, when I have one line selected, the hover tool still interacts with the unselected lines. Is it possible to get the hover tool to acknowledge the selected property?
In my actual application I have many lines that are nearly overlapping. I use other widgets to modify the selected property of the data to only show the lines of interest and set the unselected lines to be invisible. But when i use the hover tool to inspect the data it continues to interact with the hidden lines making it really confusing.
Here is example code, when you select one of the two lines, the other will disappear. But you can still see the tooltip when hovering over where the points would have been. The picture below shows an example of a “ghost” tooltip that I would like to get rid of.
import bokeh.plotting
import bokeh.io
import bokeh.layouts
from bokeh.models import TapTool, HoverTool
from bokeh.models import ColumnDataSource
import pandas as pd

# Data for plot
data = pd.DataFrame({'x': [[1, 2, 3],[1,2,3]], 'y': [[3, 4, 6], [5, 3, 1]]})
s1 = ColumnDataSource(data)
# make plot
p3 = bokeh.plotting.figure()
p3.multi_line(xs='x', ys='y', width=2, source=s1, nonselection_alpha=0)

# Add tools
hover = HoverTool()
hover.tooltips = ([('x', '@x}'), ('y', '@y')])
tap = TapTool()
p3.add_tools(tap)
p3.add_tools(hover)
# Plot
layout = bokeh.layouts.layout(p3)
bokeh.io.show(layout)
Heres my solution @EMiller
import bokeh.plotting
import bokeh.io
import bokeh.layouts
from bokeh.models import TapTool, HoverTool
from bokeh.models import ColumnDataSource, CustomJS
import pandas as pd

# Data for plot
data = pd.DataFrame({'x': [[1, 2, 3],[1,2,3]], 'y': [[3, 4, 6], [5, 3, 1]]})
s1 = ColumnDataSource(data)
s2 = ColumnDataSource(data)
# make plot
p3 = bokeh.plotting.figure()

r1 = p3.multi_line(xs='x', ys='y', width=2, source=s1, line_alpha=0.5)

r2 = p3.multi_line(xs='x', ys='y', width=2, source=s2)

# Add tools
hover = HoverTool(renderers=[r2])
hover.tooltips = ([('x', '@x}'), ('y', '@y')])
tap = TapTool(renderers=[r1]
              ,callback = CustomJS(args=dict(s1=s1,s2=s2)
                                   ,code='''
                                   var i = s1.selected.indices[0];
                                   s2.data.index=[0]
                                   s2.data.x = [s1.data.x[i]];
                                   s2.data.y = [s1.data.y[i]];
                                   s2.change.emit();
                                   '''              ))

p3.add_tools(tap)
p3.add_tools(hover)
# Plot
layout = bokeh.layouts.layout(p3)
bokeh.io.show(layout)
The “trick” here is to have two sources: one to display the currently selected line and provide the hovertool for it (s2/r2), and the other to store/display all the other lines, be accessible by the TapTool but not to by the hover (s1/r1). The javascript callback attached to the taptool executes when the user clicks on a line from r1. The callback identifies the indices of the tapped line from r1, and replaces the xy data that’s driving r2 with xy data ONLY for that one selected index in s1.
One could probably use CDS view for a “one ColumnDataSource” solution as well. Also note that to r2 could easily be a Line glyph not MultiLine glyph (would need to modify the callback a bit to do this though), as it’s only displaying one line at time.
Thanks @gmerritt123 for the solution! Updating the data in a second CDS does seem to be the best way to get that behavior to go away.
I was originally hoping to stick with only the “Selected” data so that i didn’t need to create the second CDS, but that doesn’t seem possible at this point.
1 Like
