Hello,
I’m somewhat new to Bokeh. I have an interactive webpage where a user can click on multiple “stations”. Clicking on each station opens a new div and the user can use checkboxes to display some data relevant to that station. I’m trying to replace the plotting element with bokehJS and it’s mostly been successful but I’m running into a glitch and confused about how to continue. The overarching question is : what is the best way in BokehJS to embed the same type of document into multiple divs? An example is below:
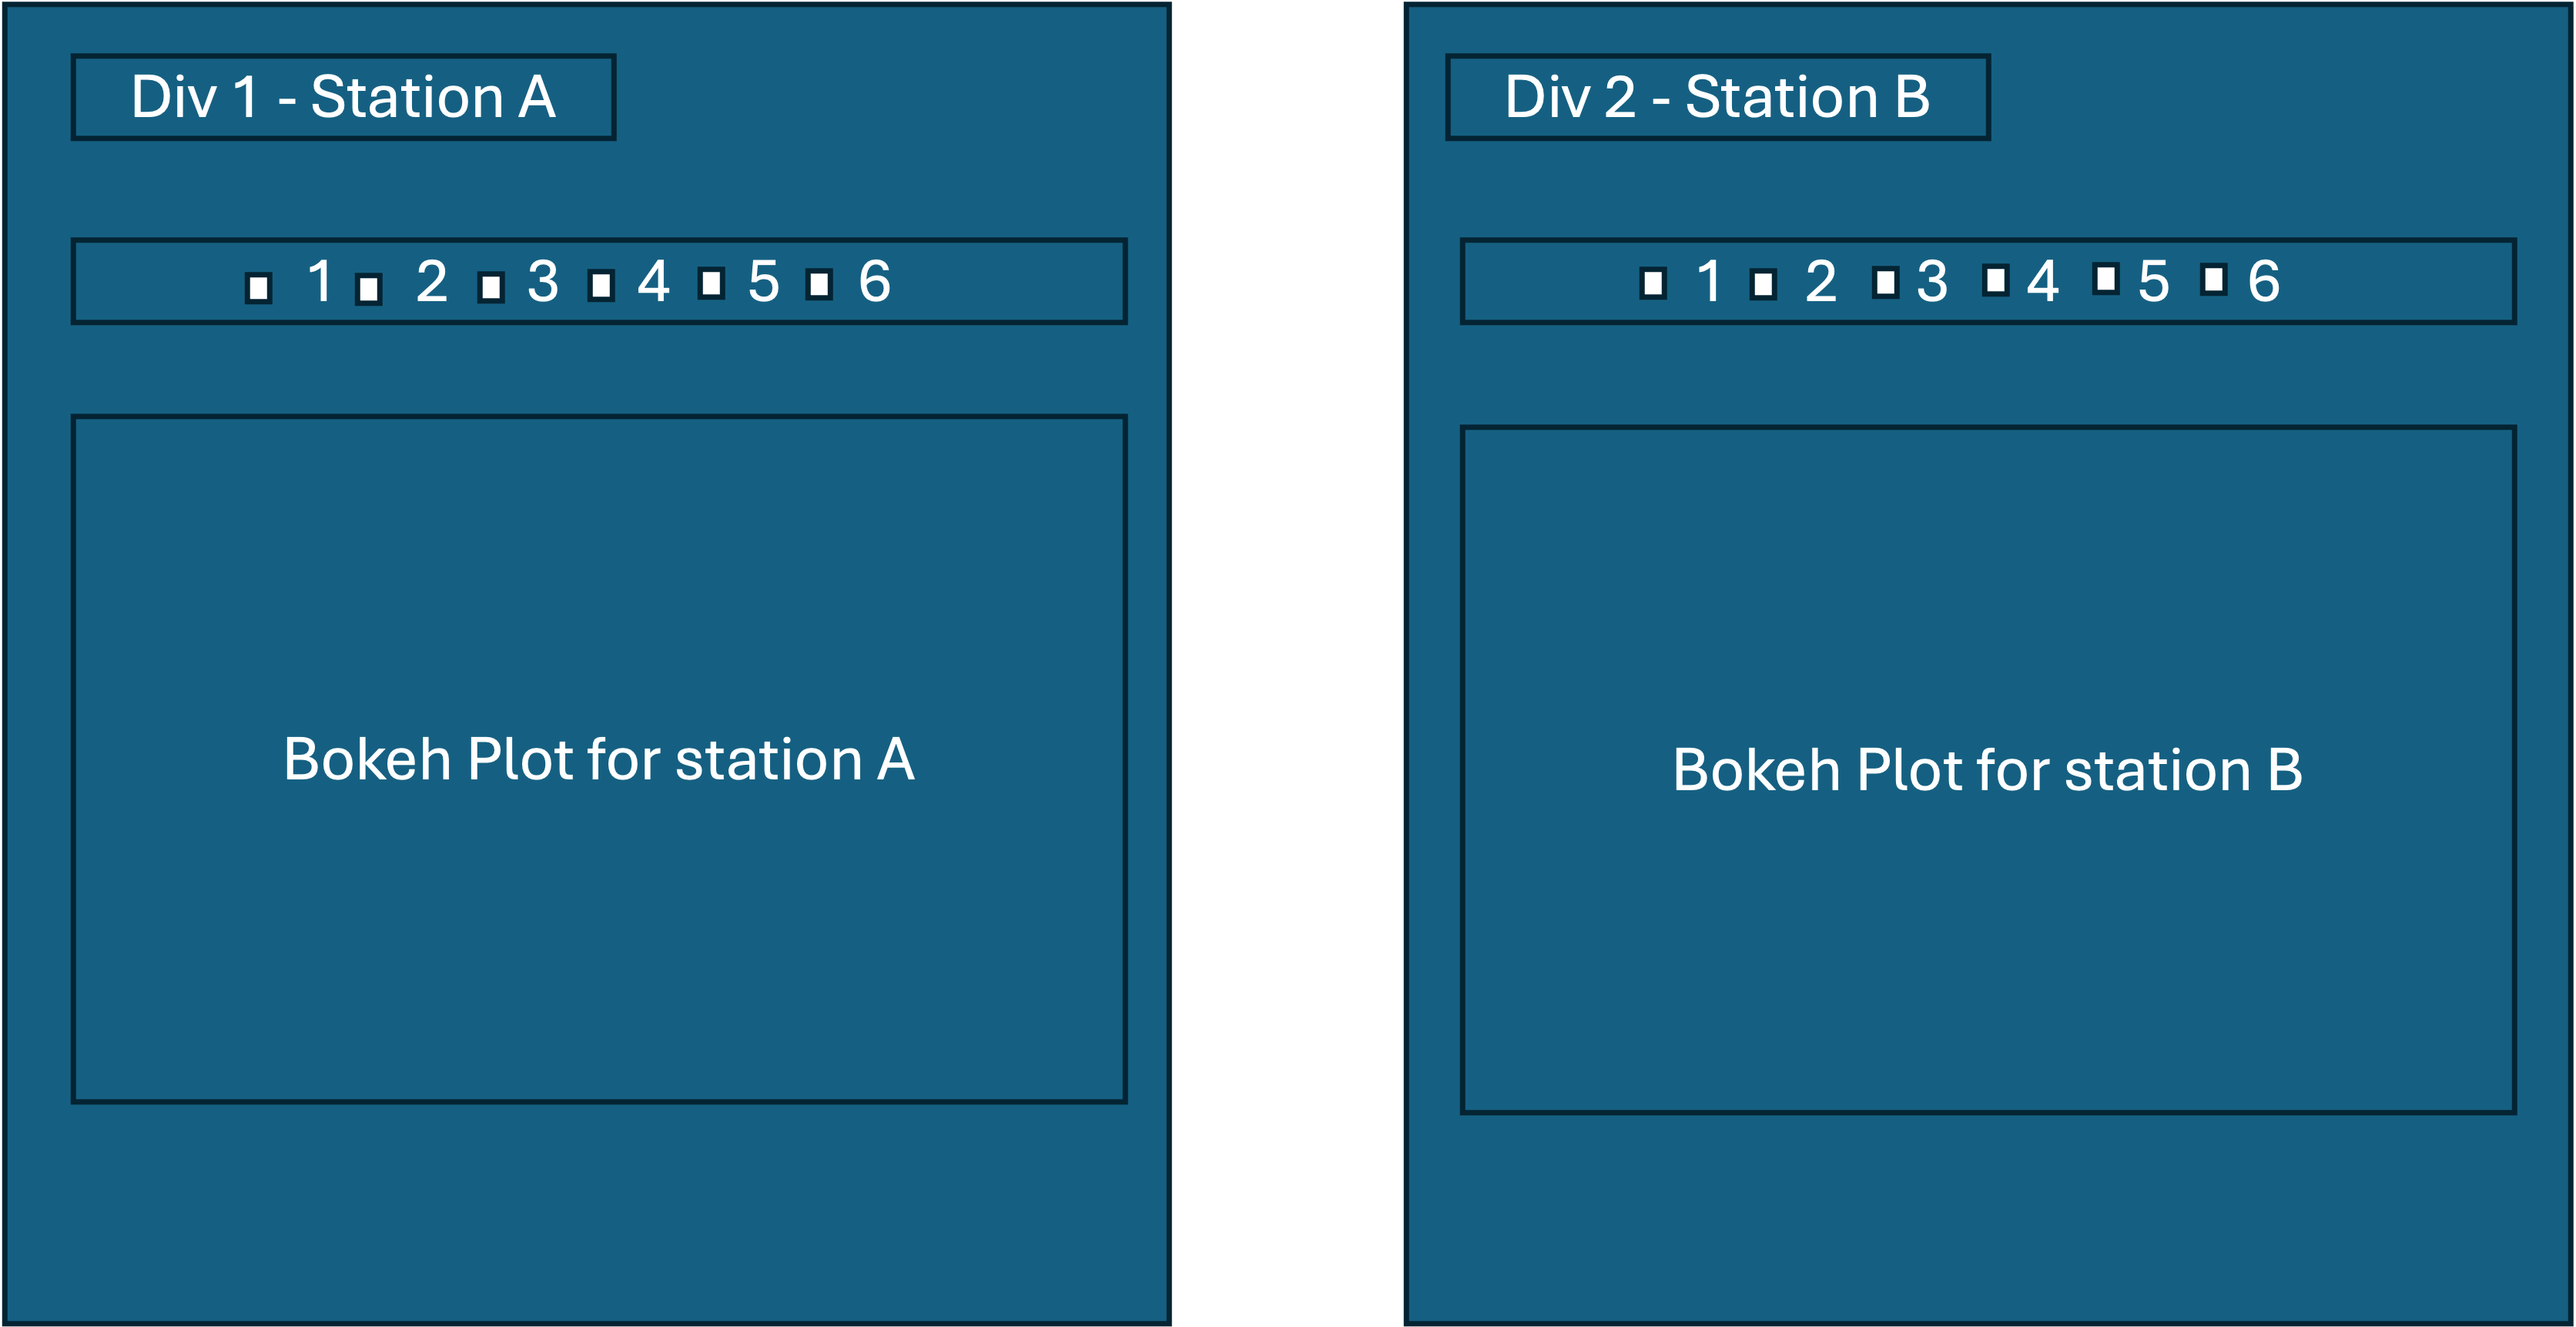
Station A and Station B are two separate divs, each of them have data streams, say 1-6 that can be made visible or hidden by clicking the checkboxes. Currently the setup is that the checkboxes are not Bokeh widgets, they’re external HTML checkboxes. When i have just station A open, this works quite fine - each of the plots has a name property and I’m able to show or hide easily by selecting the plot name corresponding to the checkbox ID. But when both station A and station B are open, if I click, say “1” in the station A window, it toggles the “1” plot in the station B window. This despite the fact that I attach the Bokeh plot to a div specifically tied to the station: Bokeh.Plotting.show(plot,'#Div-'+stn); // stn can be stationA or stationB
I’m confused about how to best get past this problem - I can’t turn the entire webpage into a Bokeh layout/server, but I can potentially look into turn the checkboxes into Bokeh elements.
It’s hard to say much without actual code to look at. Offhand it sounds like you could intentionally or unintentionally re-using some objects between the two plots. Each plot should be a new distinct plot object and all of its sub-elements—glyphs, data sources, etc—should not be shared between the plots in any way. Alternatively, it could be something about how you are reacting to your external widget updates that is the problem. and not really related to the Bokeh setup at all. In order to get into anything specific or concrete, it is almost always necessary to have a complete Minimal Reproducible Example to work with.
Hello, my apologies for not including an MRE - it was going to take me some time to strip the code down to its representative essentials so I figured I’d ask first without it to see if there was something glaringly wrong with my approach. Below is my attempt at producing the most essential parts for the MRE. When I click the station button a new div is created and the stationVisualization function is called with the station name (stn) and the time of click (nowTime). Hopefully this works.
function createBokehPlot(nowTime,data,stn){

     // set up Bokeh plot


    // Form the required column data source
    var allTimeSeries = [];

    for (iData = 0; iData<data.length; iData++){

        // form the column data source
        allTimeSeries.push(new Bokeh.ColumnDataSource({data:{time:data[iData].time,
                                                            ydata:data[iData].ydata}}));

        } // end of loop through data

     // Plot range
     var xdr = new Bokeh.Range1d({ start: nowTime-86400*1000, end: nowTime });
     var ydr = new Bokeh.Range1d({ start: -5.0, end: 5.0 });

     var plot = Bokeh.Plotting.figure({
         tools: "pan,crosshair,wheel_zoom,box_zoom,reset,save",
         x_axis_type: "datetime",
         x_axis_label: "time",
         y_axis_label: "Y-data",
         x_range: xdr,
         y_range: ydr

         }); // end of bokeh plot definition


     // Plot all the lines but set visibility to off - when a checkbox is clicked, visibility will be toggled

     lineSet = [];
     for (iData = 0; iData < data.length; iData++){
          lineSet.push(plot.line({field:"time"}, {field:"ydata"}, {source: allTimeSeries[iData], name:data[iData].streamName, visible:false}));
          }

     return plot;

 } // end of createBokehPlot function


function stationVisualization(stn,nowTime){
    var stnPlotDiv = d3.selectAll('div#stationDataVisualization').append('div')
        .attr('class','stationPlot p-4 mb-4')
        .attr('id',stn);


     // Load the json file according to the station that was clicked
    d3.json('json/'+stn+'.json?v=' + Date.now()).then(function (stnData){

        //Outer div for all checkboxes
        var outsideCheckBoxDiv = stnPlotDiv.append('div')
                                            .attr('class','checkBoxGroupDiv');


        // div containing the plot
        var plotDiv = stnPlotDiv.append('div')
                                   .attr('class','plotDiv')
                                   .attr('id','plotDiv'+stn);

        // data streams inside the station json file - 1 to 6 in this example
        var allStreamNames = stnData.map(function(d){return d.streamName});

        // create Bokeh plot
        var plot = createBokehPlot(nowTime,stnData,stn);


        // set up checkboxes
        allStreamNames.forEach(function(d,i){
            var checkboxLabel =  d;
            var checkboxAndLabelDiv = outsideCheckBoxDiv.append('div')
                                                        .attr('class','checkboxAndSatLabelDiv');

            // Append checkbox to the div around the checkbox and label
            checkboxAndLabelDiv.append('div')
                               .attr('class','checkboxDiv')
                               .append('input')
                               .attr('type','checkbox')
                               .attr('class',' me-2')
                               .attr('label',checkboxLabel)
                               .on('click',function(event){
                                 // check if the box is checked
                                 var isChecked = d3.select(this).node().checked;

                                 plotSet = plot.select(name=d);

                                 plotSet.forEach(function(plots){
                                      if (isChecked) plots.visible = true;
                                      else plots.visible = false;
                                   }); //end of plotset loop

                               }); // end of checkbox click behavior


            // append checkbox labels
            checkboxAndLabelDiv.append('div')
                               .attr('class','checkboxSatLabelDiv')
                               .append("text")
                               .text(d)
                               .attr('id','checkbox-'+d)
                               .html("<label for=" +checkboxLabel +">" + d + "</label>");

        }); // end of loop through allStreams


        // Show the plot in the correct div
        Bokeh.Plotting.show(plot,'#plotDiv'+stn);

    }); //end of json load

} // end of stationVisualization
Sorry @skylar I am actually not much of a web-dev. Can you provide a complete HTML file I can open up in dev tools? That’s also important in order to know what version of Bokeh you are using.