I think it could also be any other JS visualisation library, without the need for Node.js.
from bokeh.models import Slider, CustomJS, Paragraph
from bokeh.io import curdoc
from bokeh.layouts import column

# ─── UI ELEMENTS ──────────────────────────────────────────────
text_area = Paragraph(text='Plot of 3 * x^k with Dynamic k')
slider = Slider(start=1, end=10, value=2, step=1, title="Change the value of k")

# ─── JAVASCRIPT CALLBACK ──────────────────────────────────────
create_dynamic_function_plot = CustomJS(args=dict(slider=slider), code="""
console.log('Slider Value (k):', slider.value);

// Load ECharts if not already loaded
if (typeof echarts === 'undefined') {
    const script = document.createElement('script');
    script.src = 'https://cdn.jsdelivr.net/npm/[email protected]/dist/echarts.min.js';
    script.onload = function() {
        createChart();
    };
    document.head.appendChild(script);
} else {
    createChart();
}

function createChart() {
    // Create chart container if not exists
    let chartDiv = document.getElementById('echarts_function_plot');
    if (!chartDiv) {
        chartDiv = document.createElement('div');
        chartDiv.setAttribute('id', 'echarts_function_plot');
        chartDiv.setAttribute('style', 'width: 600px; height: 400px; margin-top: 20px;');
        document.body.appendChild(chartDiv);
    }

    const myChart = echarts.init(chartDiv);
    const k = slider.value;
    console.log("Slider value (k) received in JS: " + k);

    const xValues = [];
    const yValues = [];
    for (let i = 1; i <= 10; i++) {
        xValues.push(i);
        yValues.push(3 * Math.pow(i, k));
    }

    const option = {
        title: {
            text: 'Plot of 3 * x^k'
        },
        tooltip: {
            trigger: 'axis'
        },
        xAxis: {
            type: 'category',
            data: xValues
        },
        yAxis: {
            type: 'value'
        },
        series: [{
            data: yValues,
            type: 'line',
            smooth: true
        }]
    };

    myChart.setOption(option);
}
""")

# ─── EVENT BINDING ────────────────────────────────────────────
slider.js_on_change('value', create_dynamic_function_plot)
curdoc().js_on_event('document_ready', create_dynamic_function_plot)
# ─── APP ROOT ─────────────────────────────────────────────────
curdoc().add_root(column(text_area, slider))

from bokeh.models import Slider, ColorPicker, CustomJS, Paragraph
from bokeh.io import curdoc
from bokeh.layouts import column
import numpy as np
import json
# ─── DATA: Generate 3D Surface z = sin(x² + y²) ──────────────────
n = 50
x = np.linspace(-3, 3, n)
y = np.linspace(-3, 3, n)
x_grid, y_grid = np.meshgrid(x, y)
z_grid = np.sin(x_grid**2 + y_grid**2)
data = [[x[j], y[i], z_grid[i, j]] for i in range(n) for j in range(n)]
# ─── WIDGETS ─────────────────────────────────────────────────────
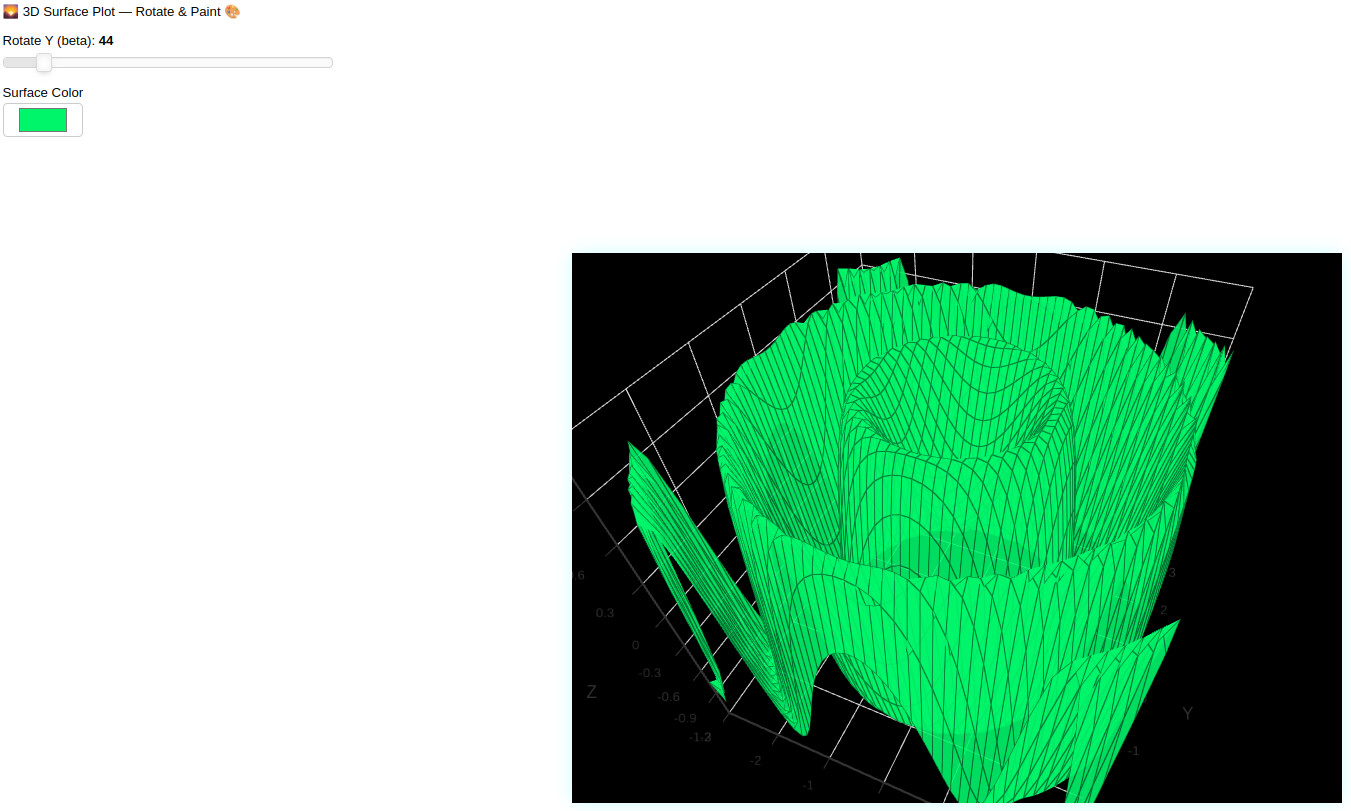
slider = Slider(start=0, end=360, value=45, step=1, title="Rotate Y (beta)")
color_picker = ColorPicker(title="Surface Color", color="#00ffe0")
text_area = Paragraph(text="🌄 3D Surface Plot — Rotate & Paint 🎨")
# ─── JS CALLBACK ─────────────────────────────────────────────────
js_callback = CustomJS(
args=dict(slider=slider, color_picker=color_picker),
code=f"""
(function() {{
const data = {json.dumps(data)};
function loadECharts(callback) {{
if (typeof echarts === 'undefined') {{
const script1 = document.createElement('script');
script1.src = 'https://cdn.jsdelivr.net/npm/[email protected]/dist/echarts.min.js';
script1.onload = function() {{
const script2 = document.createElement('script');
script2.src = 'https://cdn.jsdelivr.net/npm/[email protected]/dist/echarts-gl.min.js';
script2.onload = callback;
document.head.appendChild(script2);
}};
document.head.appendChild(script1);
}} else {{
callback();
}}
}}
function renderSurface() {{
let chartDiv = document.getElementById("echarts_surface");
if (!chartDiv) {{
chartDiv = document.createElement("div");
chartDiv.id = "echarts_surface";
chartDiv.style.cssText = `
position: fixed;
top: 100px;
left: 50%;
transform: translateX(-50%);
width: 700px;
height: 500px;
z-index: 10;
background-color: #000;
border-radius: 10px;
box-shadow: 0 0 15px rgba(0,255,255,0.2);
`;
document.body.appendChild(chartDiv);
}}
const chart = echarts.init(chartDiv);
const angle = slider.value;
const color = color_picker.color || "#00ffe0";
chart.setOption({{
tooltip: {{}},
backgroundColor: "#000",
xAxis3D: {{ type: 'value' }},
yAxis3D: {{ type: 'value' }},
zAxis3D: {{ type: 'value' }},
grid3D: {{
viewControl: {{
alpha: 40,
beta: angle,
distance: 150
}},
boxWidth: 100,
boxDepth: 100,
light: {{
main: {{ intensity: 1.2 }},
ambient: {{ intensity: 0.3 }}
}}
}},
series: [{{
type: 'surface',
data: data,
shading: 'color',
itemStyle: {{
color: color,
opacity: 0.9
}},
wireframe: {{
show: true,
color: '#1e1e1e'
}}
}}]
}});
}}
loadECharts(renderSurface);
}})();
"""
)
# ─── EVENT TRIGGERS ─────────────────────────────────────────────
slider.js_on_change('value', js_callback)
color_picker.js_on_change('color', js_callback)
curdoc().js_on_event('document_ready', js_callback)
# ─── FINAL APP ROOT ─────────────────────────────────────────────
curdoc().add_root(column(text_area, slider, color_picker))
from bokeh.models import Slider, CustomJS, Paragraph
from bokeh.io import curdoc
from bokeh.layouts import column
# ─── UI ELEMENTS ──────────────────────────────────────────────
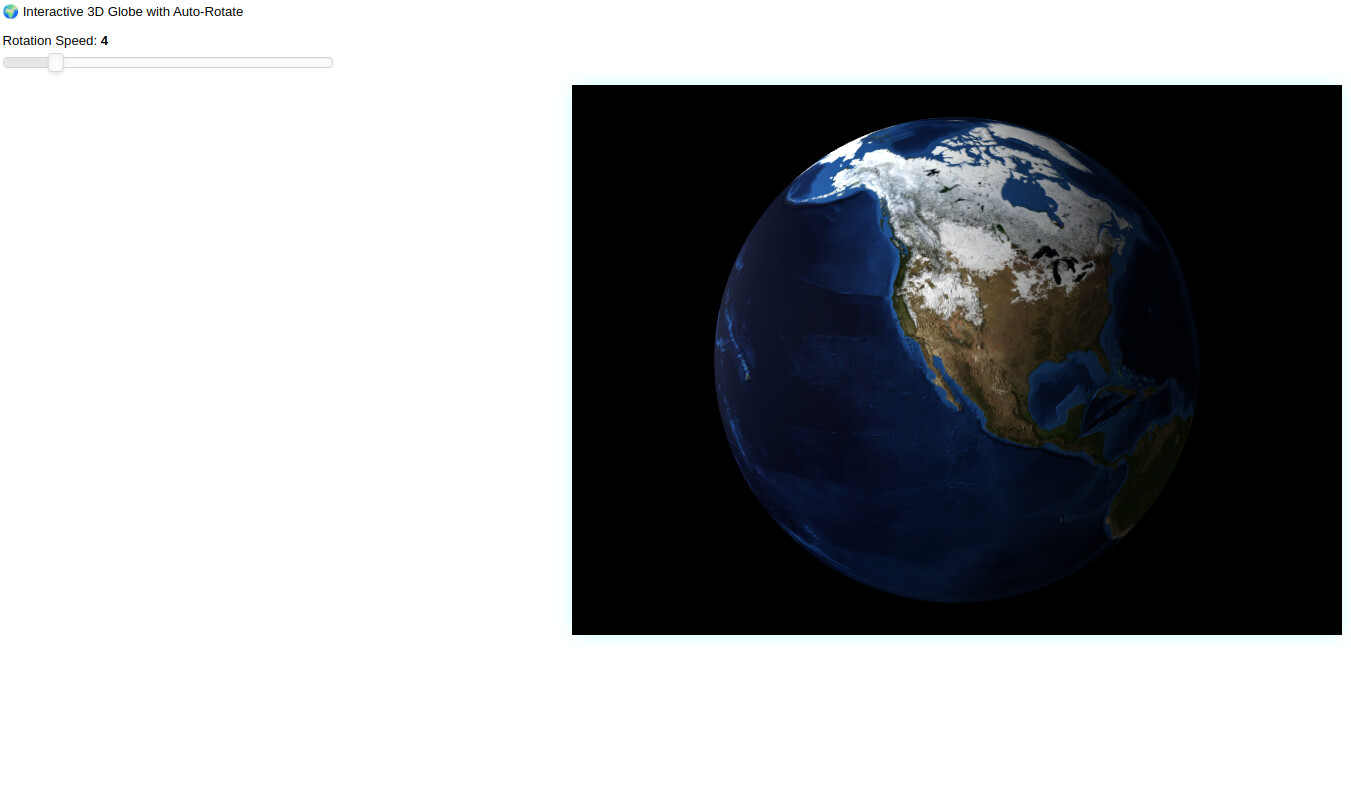
text_area = Paragraph(text='🌍 Interactive 3D Globe with Auto-Rotate')
slider = Slider(
start=1,
end=20,
value=5,
step=1,
title="Rotation Speed"
)
# ─── JAVASCRIPT CALLBACK ──────────────────────────────────────
sphere_js = CustomJS(args=dict(slider=slider), code="""
(function() {
function createGlobe() {
if (typeof echarts === 'undefined') {
const script1 = document.createElement('script');
script1.src = 'https://cdn.jsdelivr.net/npm/[email protected]/dist/echarts.min.js';
script1.onload = function() {
const script2 = document.createElement('script');
script2.src = 'https://cdn.jsdelivr.net/npm/[email protected]/dist/echarts-gl.min.js';
script2.onload = renderGlobe;
document.head.appendChild(script2);
};
document.head.appendChild(script1);
} else {
renderGlobe();
}
}
function renderGlobe() {
let chartEl = document.getElementById("echarts_sphere_canvas");
if (!chartEl) {
chartEl = document.createElement("div");
chartEl.id = "echarts_sphere_canvas";
chartEl.style.cssText = `
position: fixed;
top: 80px;
left: 50%;
transform: translateX(-50%);
width: 700px;
height: 500px;
z-index: 10;
background-color: black;
border-radius: 8px;
box-shadow: 0 0 15px rgba(0,255,255,0.2);
`;
document.body.appendChild(chartEl);
}
const myChart = echarts.init(chartEl);
const speed = slider.value;
const option = {
backgroundColor: '#000',
globe: {
baseTexture: 'https://cdn.jsdelivr.net/gh/apache/echarts-website@asf-site/examples/data-gl/asset/world.topo.bathy.200401.jpg',
heightTexture: 'https://cdn.jsdelivr.net/gh/apache/echarts-website@asf-site/examples/data-gl/asset/bathymetry_bw_composite_4k.jpg',
shading: 'realistic',
environment: '#000',
realisticMaterial: {
roughness: 0.8,
metalness: 0
},
viewControl: {
autoRotate: true,
autoRotateSpeed: speed,
distance: 160
},
light: {
main: { intensity: 1.2 },
ambient: { intensity: 0.3 }
}
}
};
myChart.setOption(option);
window.addEventListener("resize", () => myChart.resize());
}
// Delay to allow DOM readiness
setTimeout(createGlobe, 100);
})();
""")
# ─── EVENT BINDING ────────────────────────────────────────────
slider.js_on_change('value', sphere_js)
curdoc().js_on_event('document_ready', sphere_js)
# ─── APP ROOT ─────────────────────────────────────────────────
curdoc().add_root(column(text_area, slider))
from bokeh.io import curdoc
from bokeh.layouts import column
from bokeh.models import CustomJS, Select, Paragraph
import json
# ─── DATASETS ─────────────────────────────────────────────────────
datasets = {
"February": {
"days": ['Mon', 'Tue', 'Wed', 'Thu'],
"hours": ['Revenue', 'Clients', 'Check-ins', 'Visits'],
"data": [
[0, 0, 5], [0, 1, 1], [0, 2, 2], [0, 3, 8],
[1, 0, 3], [1, 1, 5], [1, 2, 1], [1, 3, 9],
[2, 0, 4], [2, 1, 8], [2, 2, 4], [2, 3, 8],
[3, 0, 6], [3, 1, 7], [3, 2, 4], [3, 3, 9]
]
},
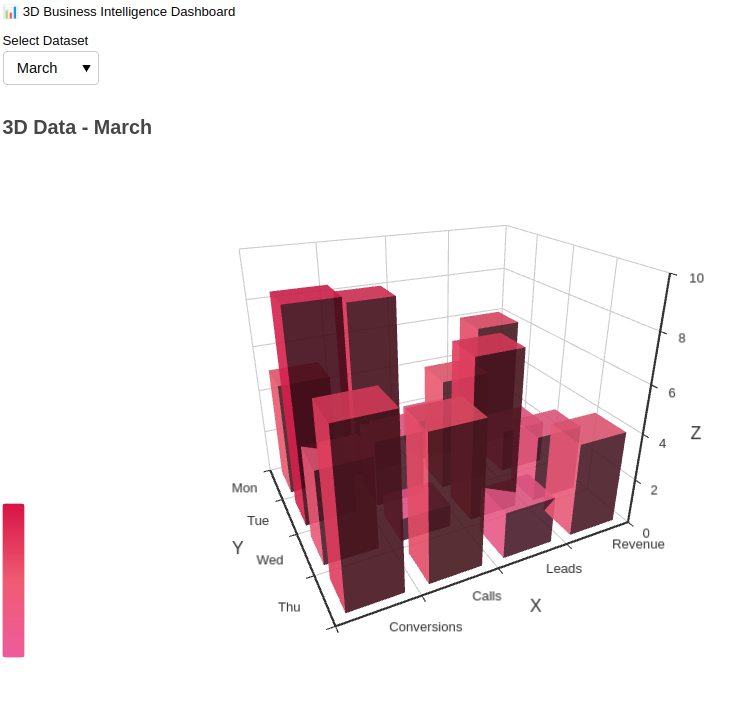
"March": {
"days": ['Mon', 'Tue', 'Wed', 'Thu'],
"hours": ['Revenue', 'Leads', 'Calls', 'Conversions'],
"data": [
[0, 0, 6], [0, 1, 2], [0, 2, 3], [0, 3, 4],
[1, 0, 2], [1, 1, 5], [1, 2, 7], [1, 3, 2],
[2, 0, 8], [2, 1, 3], [2, 2, 1], [2, 3, 6],
[3, 0, 5], [3, 1, 9], [3, 2, 4], [3, 3, 7]
]
},
"April": {
"days": ['Mon', 'Tue', 'Wed', 'Thu'],
"hours": ['Signup', 'Email', 'Chat', 'Feedback'],
"data": [
[0, 0, 3], [0, 1, 7], [0, 2, 4], [0, 3, 6],
[1, 0, 5], [1, 1, 6], [1, 2, 3], [1, 3, 8],
[2, 0, 4], [2, 1, 5], [2, 2, 5], [2, 3, 4],
[3, 0, 6], [3, 1, 7], [3, 2, 6], [3, 3, 5]
]
}
}
dataset_json = json.dumps(datasets)
# ─── UI ────────────────────────────────────────────────────────────
title = Paragraph(text="📊 3D Business Intelligence Dashboard", width=400)
dropdown = Select(title="Select Dataset", value="February", options=list(datasets.keys()))
# ─── JS CALLBACK ───────────────────────────────────────────────────
callback = CustomJS(args=dict(dropdown=dropdown), code=f"""
const datasets = {dataset_json};
const selected = dropdown.value;
const payload = datasets[selected];
const hours = payload.hours;
const days = payload.days;
const data = payload.data.map(d => {{
return {{ value: [d[0], d[1], d[2]] }};
}});
function loadECharts(cb) {{
if (!window.echarts || !window.echartsGL) {{
const echartsScript = document.createElement('script');
echartsScript.src = "https://cdn.jsdelivr.net/npm/[email protected]/dist/echarts.min.js";
echartsScript.onload = function() {{
const glScript = document.createElement('script');
glScript.src = "https://cdn.jsdelivr.net/npm/[email protected]/dist/echarts-gl.min.js";
glScript.onload = cb;
document.head.appendChild(glScript);
}};
document.head.appendChild(echartsScript);
}} else {{
cb();
}}
}}
function render() {{
let container = document.getElementById("echarts_container");
if (!container) {{
container = document.createElement("div");
container.id = "echarts_container";
container.style = "width: 800px; height: 500px; margin-top: 20px;";
document.body.appendChild(container);
}}
const chart = echarts.init(container);
const option = {{
title: {{
text: "3D Data - " + selected,
textStyle: {{
fontSize: 18,
fontWeight: "bold"
}}
}},
tooltip: {{ show: true }},
visualMap: {{
max: 10,
inRange: {{
color: ['#ef5b9c', '#f05b72', '#d71345']
}}
}},
xAxis3D: {{ type: 'category', data: hours }},
yAxis3D: {{ type: 'category', data: days }},
zAxis3D: {{ type: 'value' }},
grid3D: {{
boxWidth: 120,
boxDepth: 100,
viewControl: {{
alpha: 25,
beta: 45,
autoRotate: true,
distance: 230
}},
light: {{
main: {{ intensity: 1.2, shadow: true }},
ambient: {{ intensity: 0.3 }}
}}
}},
series: [{{
type: 'bar3D',
data: data,
shading: 'lambert',
label: {{ show: false }},
itemStyle: {{ opacity: 0.9 }}
}}]
}};
chart.setOption(option);
window.addEventListener("resize", () => chart.resize());
}}
loadECharts(render);
""")
# ─── Interactions ─────────────────────────────────────────────
dropdown.js_on_change('value', callback)
curdoc().js_on_event('document_ready', callback)
# ─── APP ROOT ─────────────────────────────────────────────────
curdoc().add_root(column(title, dropdown))
from bokeh.io import curdoc
from bokeh.layouts import column
from bokeh.models import Slider, CustomJS, Paragraph
import numpy as np
import json
# ─── UI Elements ─────────────────────────────────────────────
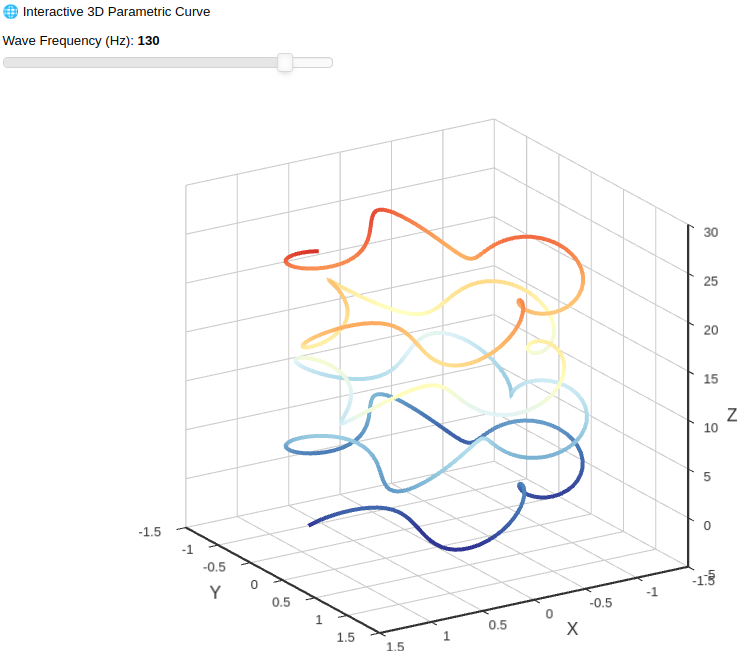
title = Paragraph(text="🌐 Interactive 3D Parametric Curve", width=600)
freq_slider = Slider(start=10, end=150, step=1, value=75, title="Wave Frequency (Hz)")
# ─── JS Callback ─────────────────────────────────────────────
callback = CustomJS(args=dict(freq_slider=freq_slider), code="""
const freq = freq_slider.value;
console.log("Generating curve with frequency:", freq);
function generateData(freq) {
const data = [];
for (let t = 0; t < 25; t += 0.05) {
const x = (1 + 0.25 * Math.cos(freq * t)) * Math.cos(t);
const y = (1 + 0.25 * Math.cos(freq * t)) * Math.sin(t);
const z = t + 2.0 * Math.sin(freq * t);
data.push([x, y, z]);
}
return data;
}
function loadECharts(cb) {
if (!window.echarts || !window.echartsGL) {
const echartsScript = document.createElement('script');
echartsScript.src = "https://cdn.jsdelivr.net/npm/[email protected]/dist/echarts.min.js";
echartsScript.onload = function() {
const glScript = document.createElement('script');
glScript.src = "https://cdn.jsdelivr.net/npm/[email protected]/dist/echarts-gl.min.js";
glScript.onload = cb;
document.head.appendChild(glScript);
};
document.head.appendChild(echartsScript);
} else {
cb();
}
}
function renderCurve() {
let div = document.getElementById("echarts_curve");
if (!div) {
div = document.createElement("div");
div.id = "echarts_curve";
div.style = "width: 800px; height: 500px; margin-top: 20px;";
document.body.appendChild(div);
}
const chart = echarts.init(div);
const curveData = generateData(freq);
const option = {
tooltip: {},
backgroundColor: '#fff',
visualMap: {
show: false,
dimension: 2,
min: 0,
max: 30,
inRange: {
color: [
'#313695', '#4575b4', '#74add1', '#abd9e9', '#e0f3f8',
'#ffffbf', '#fee090', '#fdae61', '#f46d43', '#d73027', '#a50026'
]
}
},
xAxis3D: { type: 'value' },
yAxis3D: { type: 'value' },
zAxis3D: { type: 'value' },
grid3D: {
viewControl: {
projection: 'orthographic',
autoRotate: true,
distance: 200
}
},
series: [{
type: 'line3D',
data: curveData,
lineStyle: { width: 4 }
}]
};
chart.setOption(option);
window.addEventListener('resize', () => chart.resize());
}
loadECharts(renderCurve);
""")
# ─── Bokeh Bindings ──────────────────────────────────────────
freq_slider.js_on_change('value', callback)
curdoc().js_on_event('document_ready', callback)
curdoc().add_root(column(title, freq_slider))
from bokeh.io import curdoc
from bokeh.layouts import column
from bokeh.models import MultiChoice, CustomJS, Paragraph
import numpy as np
import json
# 🔹 Generate Mock 3D category data
categories = ["A", "B", "C", "D"]
data = {}
colors = {
"A": "#00f2ff",
"B": "#ff0080",
"C": "#ffe100",
"D": "#6fff00"
}
np.random.seed(42)
for cat in categories:
x = np.random.uniform(-10, 10, 30).tolist()
y = np.random.uniform(-10, 10, 30).tolist()
z = np.random.uniform(-10, 10, 30).tolist()
pts = list(zip(x, y, z))
data[cat] = pts
# 🔹 Convert to JSON to pass into JS
data_json = json.dumps(data)
colors_json = json.dumps(colors)
# 🔹 UI Elements
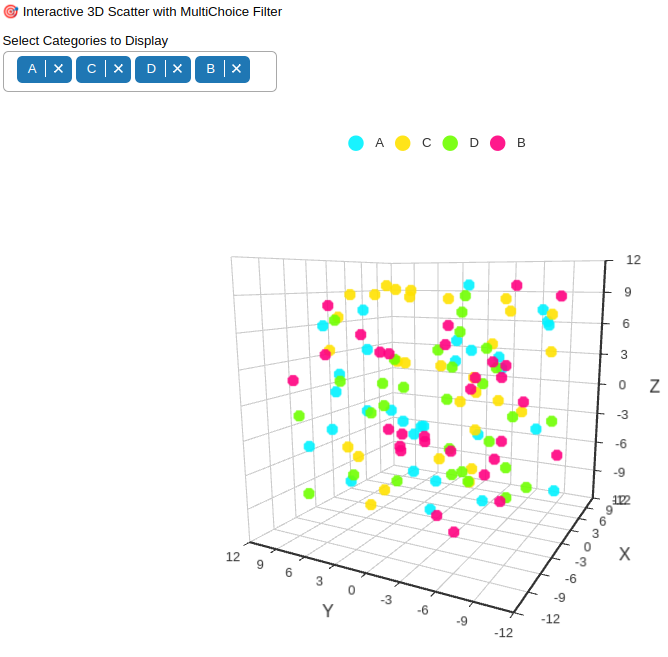
title = Paragraph(text="🎯 Interactive 3D Scatter with MultiChoice Filter", width=600)
selector = MultiChoice(title="Select Categories to Display", value=["A", "B"], options=categories)
# 🔹 JS Logic for dynamic scatter plot
js_code = """ const selected = selector.value;
const all_data = JSON.parse(data_json);
const color_map = JSON.parse(colors_json);
// Load ECharts + ECharts GL
function loadLibs(cb) {
if (!window.echarts || !window.echartsGL) {
const echartsScript = document.createElement('script');
echartsScript.src = "https://cdn.jsdelivr.net/npm/[email protected]/dist/echarts.min.js";
echartsScript.onload = function() {
const glScript = document.createElement('script');
glScript.src = "https://cdn.jsdelivr.net/npm/[email protected]/dist/echarts-gl.min.js";
glScript.onload = cb;
document.head.appendChild(glScript);
};
document.head.appendChild(echartsScript);
} else {
cb();
}
}
function renderScatter() {
let div = document.getElementById("scatter3d");
if (!div) {
div = document.createElement("div");
div.id = "scatter3d";
div.style = "width: 800px; height: 500px; margin-top: 20px;";
document.body.appendChild(div);
}
const chart = echarts.init(div);
const series = [];
for (let i = 0; i < selected.length; i++) {
const cat = selected[i];
if (all_data[cat]) {
series.push({
type: 'scatter3D',
name: cat,
symbolSize: 10,
data: all_data[cat],
itemStyle: {
color: color_map[cat],
opacity: 0.9
}
});
}
}
const option = {
tooltip: { trigger: 'item' },
legend: {
data: selected,
top: 10
},
xAxis3D: { type: 'value' },
yAxis3D: { type: 'value' },
zAxis3D: { type: 'value' },
grid3D: {
viewControl: {
projection: 'perspective',
autoRotate: true,
autoRotateSpeed: 10,
distance: 120
}
},
series: series
};
chart.setOption(option);
window.addEventListener('resize', () => chart.resize());
}
loadLibs(renderScatter);
"""
# 🔹 Link JS to widget
callback = CustomJS(args=dict(selector=selector, data_json=data_json, colors_json=colors_json), code=js_code)
selector.js_on_change("value", callback)
# Run once on load
curdoc().js_on_event('document_ready', callback)
# 🔹 Layout
curdoc().add_root(column(title, selector))