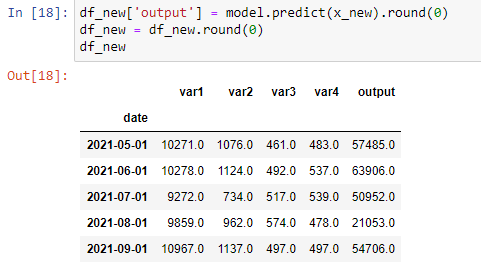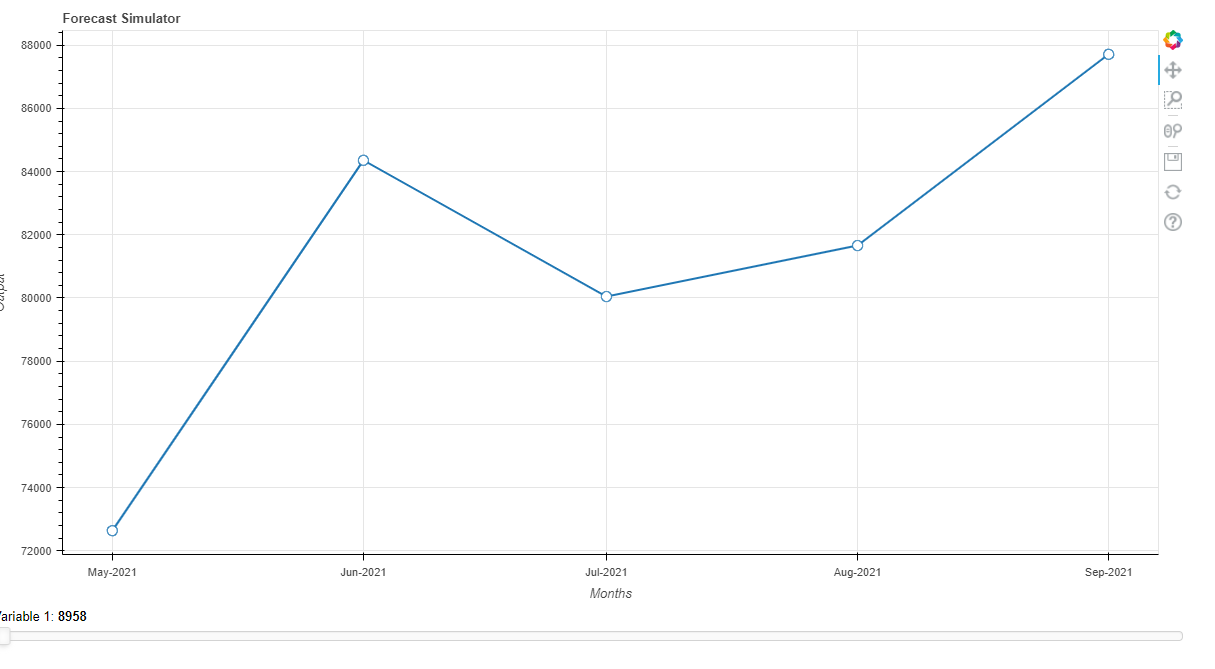
The change in slider value is not getting reflected in the plot. The plot remains static, and there is no error on the terminal.
Please help.
The change in slider value is not getting reflected in the plot. The plot remains static, and there is no error on the terminal.
Please help.
In the callback you dont have to define a new source variable.
You have to assign a new dict to the data attributte of the column data source
source.data = new dictionary
Thank you so much. I tried source.data = {'x':'date', 'y':'output'}, but it didn’t work.
Please help.
New dictionary is {‘x’: new_xarray, ‘y’: new_yarray} with the two arrays of the correct data type and same shape
Thanks again.
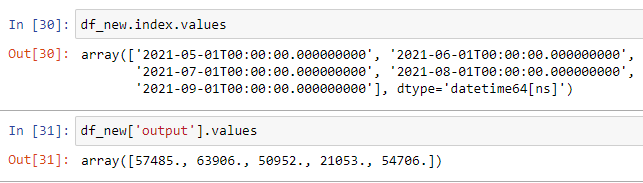
Tried, source.data={'x': df_new.index.values, 'y': df_new['output'].values}. It didn’t give an error, but the plot went blank as soon as the slider was moved.
You have to check your arrays in the dict, x has to be an array of datetime i think… but it is not possible for meto check without the data. If the plot was blank it should be the arrays are not in the right format.
here it goes a simplified example.
from bokeh.plotting import figure
from bokeh.models import ColumnDataSource, Slider
from bokeh.layouts import column
from bokeh.io import curdoc
import pandas as pd

data = {'x_values': [1, 2, 3, 4, 5],
        'y_values': [6, 7, 2, 3, 6]}
df = pd.DataFrame(data)
source = ColumnDataSource(df)

p = figure()
p.circle(x='x_values', y='y_values', source=source)

slider = Slider(value=3, start=1, end=5)

def callback(attr, old, new):
    c1 = df['x_values'] > new
    new_xarray = df['x_values'][c1]
    new_yarray = df['y_values'][c1]
    source.data = {'x_values':new_xarray,'y_values':new_yarray}

slider.on_change('value', callback)
layout = column(slider, p)
curdoc().add_root(layout)Thank you for your help. It still doesn’t work. Have deleted the index from dataframe, and replaced the date column with the month(integer) column.
    from bokeh.plotting import figure
    from bokeh.models import DatetimeTickFormatter, PrintfTickFormatter, ColumnDataSource, Slider
    from bokeh.io import curdoc
    from bokeh.layouts import column

    # Create the ColumnDataSource
    source = ColumnDataSource(df_new)
    x = 'month'
    y = 'output'

    # Create the plot
    plot = figure(plot_width=1200, plot_height=600, title='Forecast Simulator',
                  x_axis_label='Months', y_axis_label='Output')
    plot.yaxis.formatter = PrintfTickFormatter(format="%7f")
    #plot.xaxis.formatter = DatetimeTickFormatter(months = ['%b-%Y'])
    plot.line(x, y, line_width=2, source=source)
    plot.circle(x, y, fill_color='white', size=10, source=source)

    # Create the slider
    slider = Slider(start=1000, end=1000000, value=8958,
                   step=50, title='Variable 1')
    # Add callback to the widgets
    def callback(attr, old, new):
        c2 = df_new['month'] > new
        df_new.iloc[0,1] = slider.value
        df_new.iloc[0,5] = model.predict(df_new.iloc[0:1,1:5].values).round(0)[0]
        new_x = df_new['month'][c2]
        new_y = df_new['output'][c2]
        source.data={'x': new_x, 'y': new_y}


    # Slider change values
    slider.on_change('value', callback)
    # Layout Definition
    layout = column(plot, slider)
    # Add layout to the current document
curdoc().add_root(layout)Finally, it is resolved…
def callback(attr, old, new):
    df_new.iloc[0,1] = slider.value
    df_new.iloc[0,5] = model.predict(df_new.iloc[0:1,1:5].values).round(0)[0]
    source.data = dict(df_new)