numlines=len(df.columns)
col = list(df.columns)
ind = list(df.index)
source = ColumnDataSource(df)
all_colors = [k for k,v in pltc.cnames.items()]
colors = all_colors[:numlines]

legend_it = []
p = figure(width=1250, height=1100, x_axis_type="datetime", title="Monthly Data Usage", title_location='above')
p.xaxis.axis_label = 'Date Range'
p.yaxis.axis_label = 'Data Used'

for (cl, color) in zip(col, colors):
    c = p.line(x='deviceDUDay', y=cl, line_width=2, alpha=0.8, source=source, color = color )
    legend_it.append((cl, [c]))
    p.add_tools(HoverTool(
            renderers=[c],
            tooltips=[('datetime','@deviceDUDay{%Y-%m-%d}'),(cl, f'@{cl}')],
            formatters={'deviceDUDay': 'datetime'}))
print(source.data.keys())

legend = Legend(items=legend_it, location=(300, 0), spacing = 5)
p.add_layout(legend, 'right')

p.legend.label_text_font_size = '10px'
p.legend.location='center'
p.legend.click_policy="hide"

slider = Slider(start=0, end=10000, step=100, value=200)

def callback(attr, old, new):
    value = slider.value
    new_data = df.loc[:, (df.sum() >= value)]
    source.data = new_data

slider.on_change('value', callback)

layout = column(widgetbox(slider), p)
curdoc().add_root(layout)
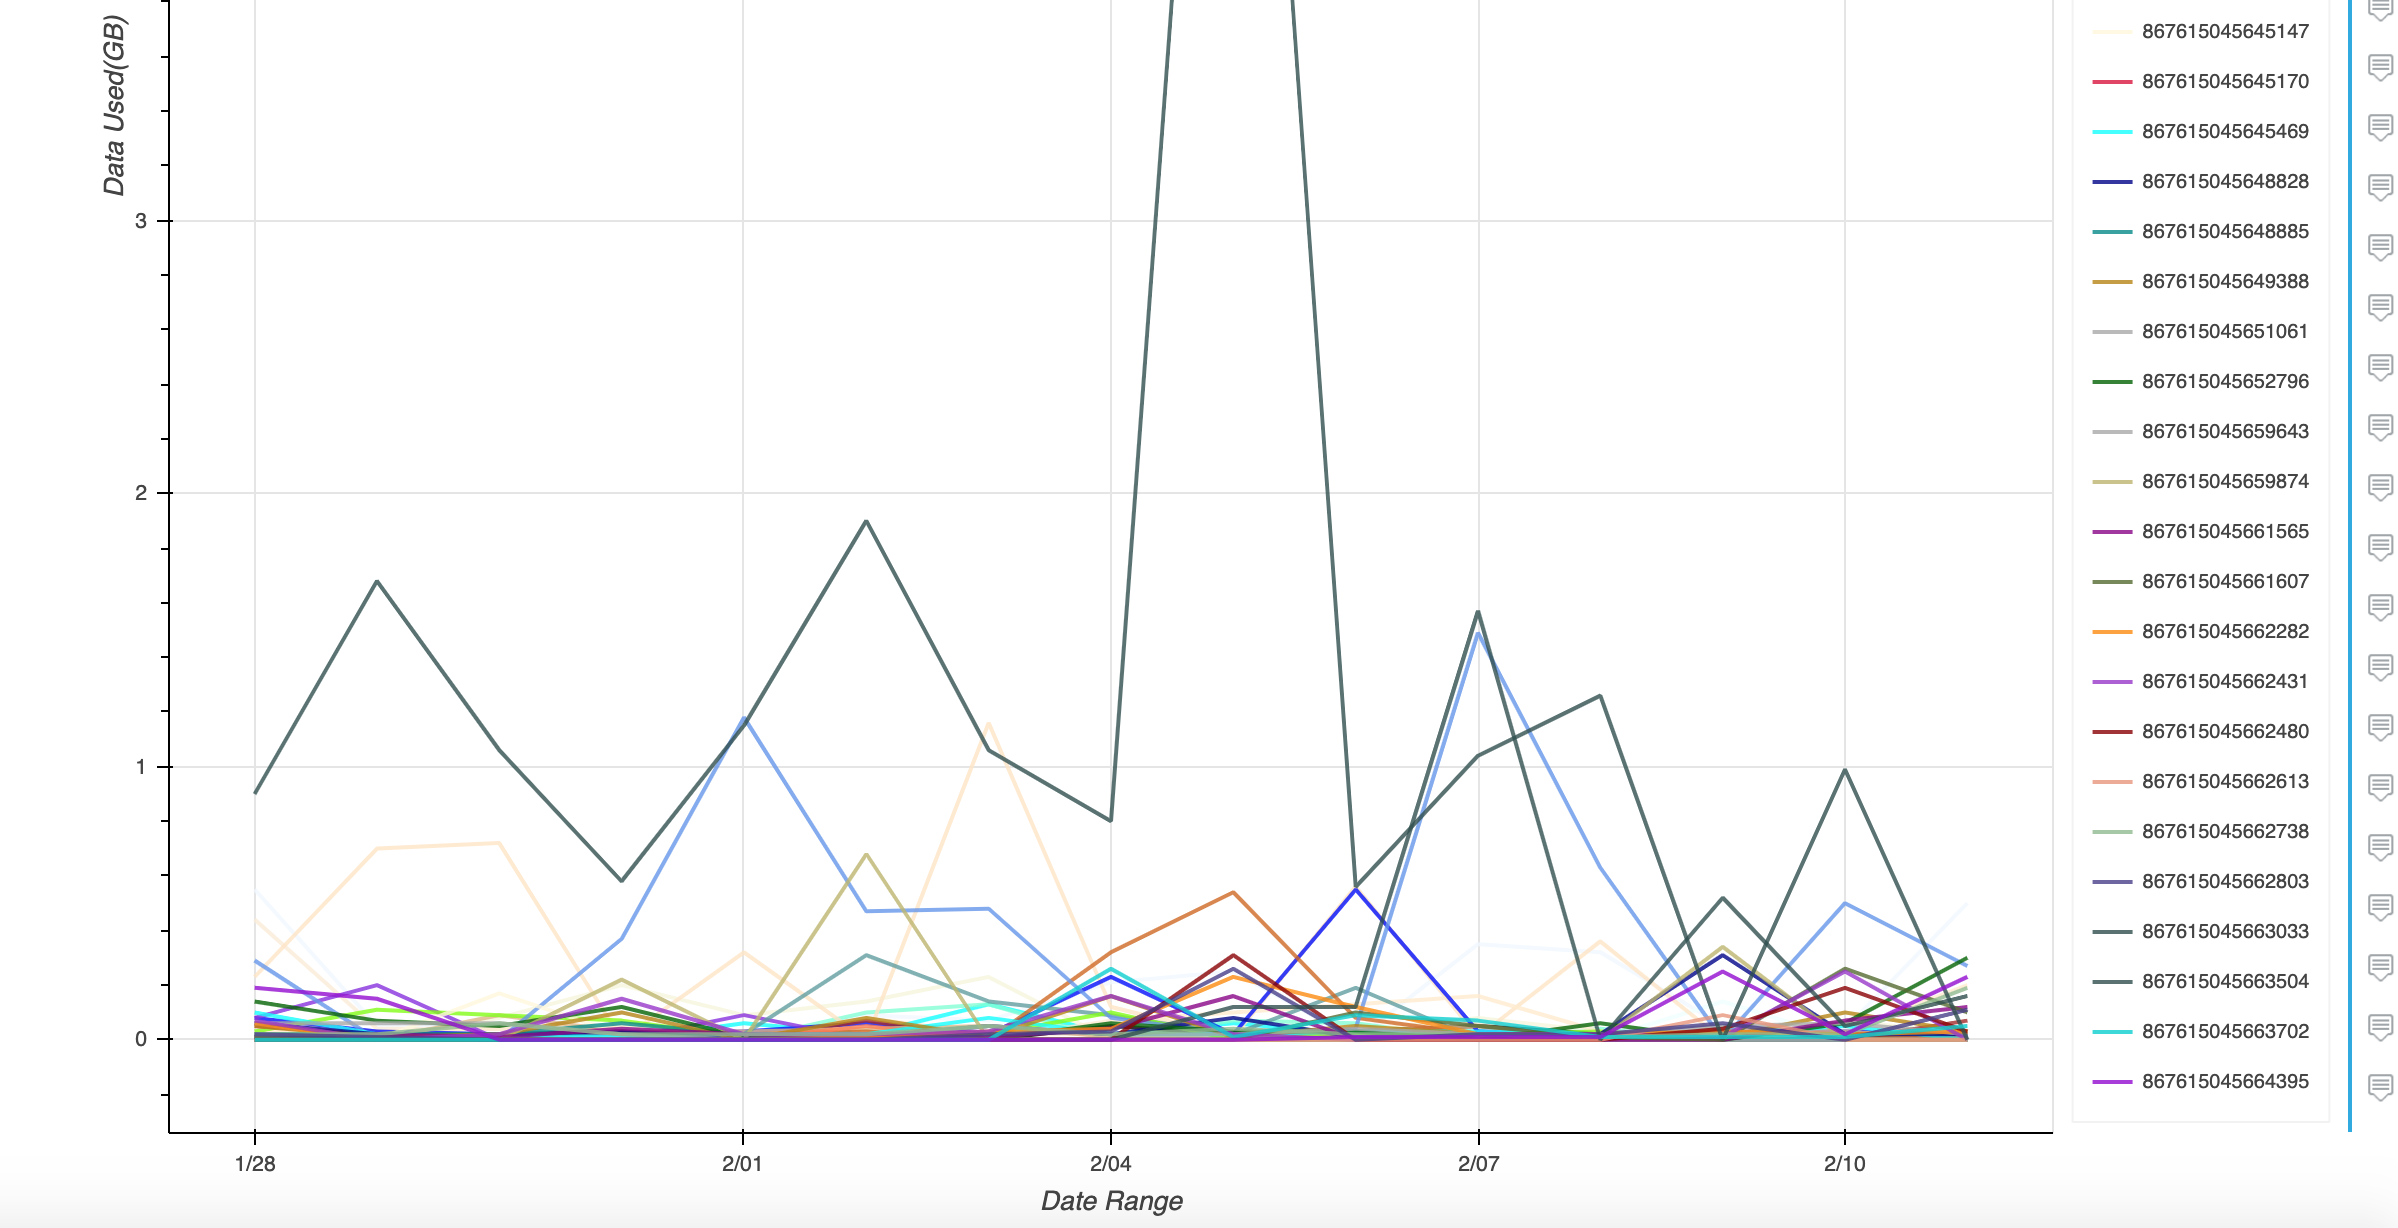
The multiline plotting works.
I want to add slider, based on the slider value, it would show the number of line plots accordingly. But when i add the slider functionality, the plot doesn’t change.
Also I am running it using bokeh serve, since its a python callback.
I feel the source data doesn’t get updated which plotting lines in a loop.
I’ve tried printing out the source data from callback function, it displays the proper truncated data frame according to the slider value properly, i.e., if I hover over the plots, the hovertips shows value of line plots based on slider which is nice, But the plots which does not satisfy slider value are not hiding. Am I missing something?
Please help!
Thank you!