#!/usr/bin/python
#coding:utf-8
from bokeh.plotting import figure, output_file, show
from bokeh.models import FixedTicker
from numpy import arange
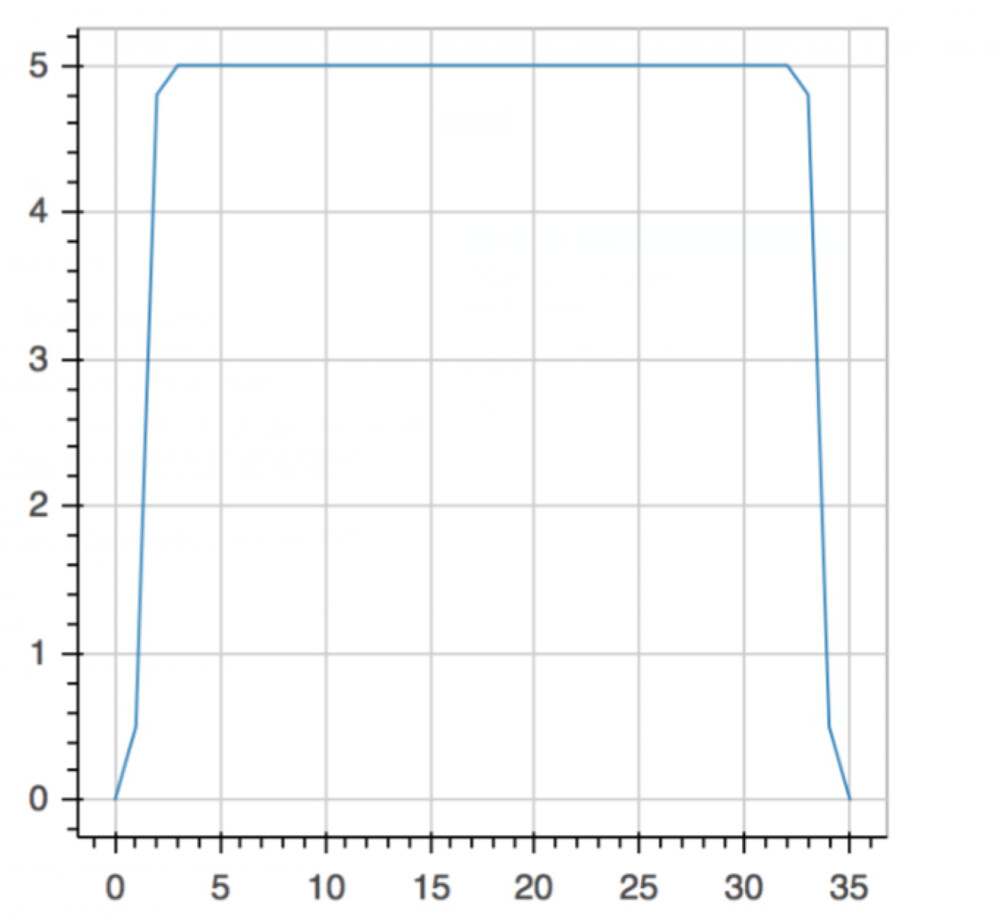
x = arange(0,36,1)
y = [0,0.5,4.8,5,5,5,5,5,5,5,5,5,5,5,5,5,5,5,5,5,5,5,5,5,5,5,5,5,5,5,5,5,5,4.8,0.5,0]
output_file(“fangbo.html”)
p = figure(plot_width=400, plot_height=400)
p.line(x,y)
show(p)
``
Hi,
I’m still new in bokeh.
I’m currently building on a visualization project with some discrete points,
such as x = arang(0,36,1) y = [0,0.5,4.8,5…(28)…5,4.8,0.5,0],I use
Then run this code I got a line chart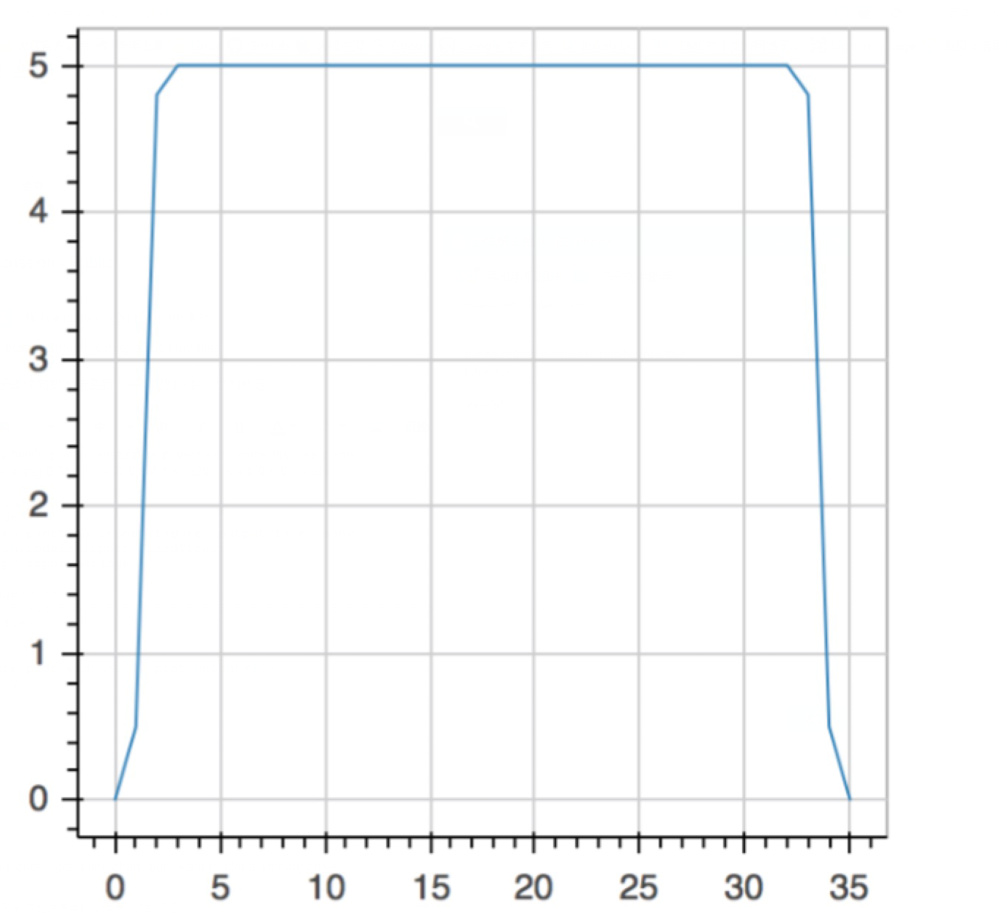 , but I want to plot a smooth cruve
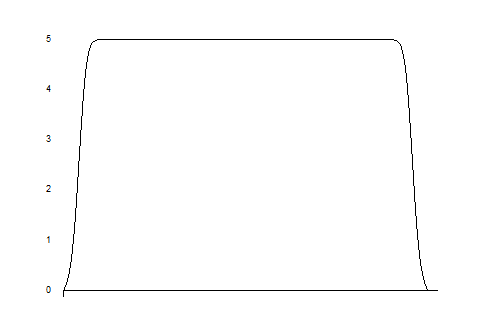
How can I fit the cruve to make it smooth. I didn’t find answer in bokeh doc, so I hope solve this problem in here.
Thanks a lot 
Shuai Yang