Hello,
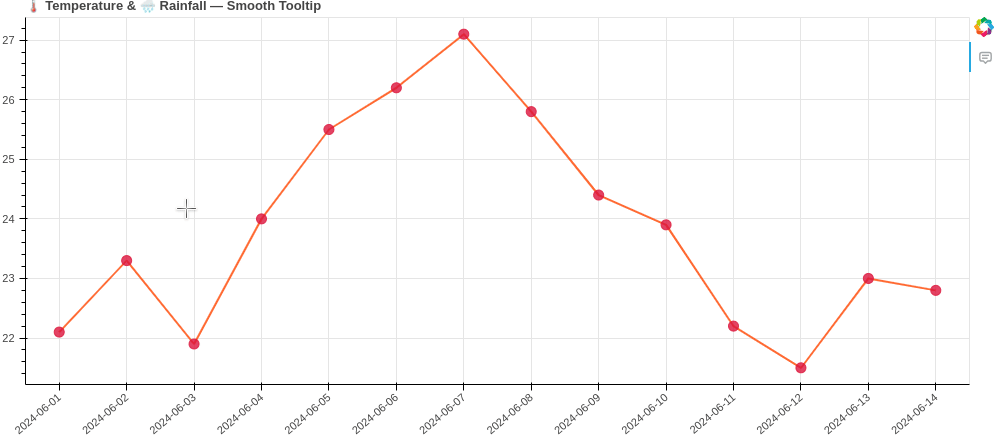
For a long time, I have tried to make the hover tooltip smoothier. Here is a smoothier tooltip for scatter/line plots. It needs some further work/modification for other plots ![]() .
.
from bokeh.plotting import figure, show
from bokeh.models import ColumnDataSource, CustomJS, HoverTool
from bokeh.io import output_file

# 🔢 Example data
dates = [f"2024-06-{str(i).zfill(2)}" for i in range(1, 15)]
temps = [22.1, 23.3, 21.9, 24.0, 25.5, 26.2, 27.1, 25.8, 24.4, 23.9, 22.2, 21.5, 23.0, 22.8]
rain = [1.2, 0.0, 2.1, 0.5, 0.0, 0.3, 0.0, 1.8, 2.5, 0.0, 0.7, 1.3, 0.0, 0.2]

x_vals = list(range(len(dates)))
labels = [f"<b>{d}</b><br>🌡️ {t}°C<br>🌧️ {r}mm" for d, t, r in zip(dates, temps, rain)]

source = ColumnDataSource(data=dict(
    x=x_vals,
    y=temps,
    rain=rain,
    label=labels
))

p = figure(
    title="🌡️ Temperature & 🌧️ Rainfall — Smooth Tooltip",
    tools="",
    width=1000,
    height=450,
    x_range=(min(x_vals) - 0.5, max(x_vals) + 0.5)
)

p.line('x', 'y', source=source, line_width=2, color="orangered", alpha=0.8)
renderer = p.circle('x', 'y', size=10, source=source, color="crimson", alpha=0.8)

# Tick labels as human-readable dates
p.xaxis.ticker = x_vals
p.xaxis.major_label_overrides = {i: dates[i] for i in x_vals}
p.xaxis.major_label_orientation = 0.7

# 🧠 Tooltip with smoother hide delay and animation
callback = CustomJS(args=dict(source=source), code="""
    const data = source.data;
    const radius = 0.3;

    let tooltip = document.getElementById('smart-tooltip');
    if (!tooltip) {
        tooltip = document.createElement('div');
        tooltip.id = 'smart-tooltip';
        tooltip.style.position = 'absolute';
        tooltip.style.padding = '12px';
        tooltip.style.background = 'linear-gradient(135deg, #111, #222)';
        tooltip.style.color = '#00FFCC';
        tooltip.style.border = '1px solid #00ffff';
        tooltip.style.borderRadius = '10px';
        tooltip.style.pointerEvents = 'none';
        tooltip.style.transition = 'opacity 0.4s ease';
        tooltip.style.fontFamily = 'monospace';
        tooltip.style.fontSize = '13px';
        tooltip.style.zIndex = '1000';
        tooltip.style.boxShadow = '0 0 15px rgba(0,255,255,0.4)';
        tooltip.style.opacity = 0;
        tooltip.style.display = 'none';
        document.body.appendChild(tooltip);
    }

    const {sx, sy, x: xvals, y: yvals, label} = data;
    let found = false;

    const dist = (a, b) => Math.sqrt(Math.pow(a, 2) + Math.pow(b, 2));

    for (let i = 0; i < xvals.length; i++) {
        const dx = xvals[i] - cb_obj.x;
        const dy = yvals[i] - cb_obj.y;
        if (dist(dx, dy) < radius) {
            tooltip.innerHTML = label[i];
            tooltip.style.left = (cb_obj.sx + 15) + 'px';
            tooltip.style.top = (cb_obj.sy - 35) + 'px';

            if (tooltip.hideTimeout) {
                clearTimeout(tooltip.hideTimeout);
                tooltip.hideTimeout = null;
            }

            tooltip.style.display = 'block';
            requestAnimationFrame(() => {
                tooltip.style.opacity = 1;
            });

            found = true;
            break;
        }
    }

    if (!found) {
        tooltip.style.opacity = 0;
        if (!tooltip.hideTimeout) {
            tooltip.hideTimeout = setTimeout(() => {
                tooltip.style.display = 'none';
                tooltip.hideTimeout = null;
            }, 400);  // delay matches CSS transition
        }
    }
""")

hover_tool = HoverTool(tooltips=None, renderers=[renderer])
p.add_tools(hover_tool)
p.js_on_event("mousemove", callback)

output_file("line_chart_smooth_tooltip.html")
show(p)