Sure…
The CSV files are attached.
import pandas as pd
from bokeh.io import show
from bokeh.plotting import figure
from bokeh.transform import factor_cmap
from bokeh.models import ColumnDataSource, \
FuncTickFormatter, \
DatetimeTickFormatter
#from bokeh.sampledata.stocks import GOOG
read a CSV file
def read_csv(filename):
dataframes have an datetime index: “DateTimeSecs”
date_column = [“DateTimeSecs”]
index_column = “DateTimeSecs”
df = pd.read_csv(filename, parse_dates = date_column).set_index(index_column)
return df
plot candlestick chart
def plot_ohlcv(df):
df[‘inc’] = (df.open < df.close).astype(int).astype(str)
df[‘date’] = pd.to_datetime(df[‘date’]) # Have real dates in ‘date’ column
df[‘date’] = df.index # only assing the index to new column: “date”
df.reset_index(drop=True, inplace=True) # And a simple range(0,n) index
source = ColumnDataSource(df)
Axis type must be linear and df.index a simple range index
p = figure(x_axis_type=‘linear’,
plot_width=1000,
tools=‘pan,wheel_zoom’,
active_scroll=‘wheel_zoom’,
active_drag=‘pan’)
Plot high-low segment and candles, colored appropriately
p.segment(‘index’, ‘high’, ‘index’, ‘low’, source=source, color=“black”)
p.vbar(‘index’, .7, ‘open’, ‘close’, source=source, line_color=‘black’,
fill_color=factor_cmap(‘inc’, [‘tomato’, ‘lime’], [‘0’, ‘1’]))
Override x axis formatter with a custom JS function formatter
Could avoid using FuncTickFormatter if GH-4272 were available
p.xaxis.formatter = FuncTickFormatter(
args=dict(
We pass in the x axis itself, so we can access its
ticks values
axis=p.xaxis[0],
An instance of DatetimeTickFormatter to nicely format
arbitrary precision datetimes
formatter=DatetimeTickFormatter(days=[‘%d %b’, ‘%a %d’],
months=[‘%m/%Y’, “%b %y”]),
Our column data source with ‘date’ column we will
map indexes through
source=source,
),
code=“”"
// We override this axis’ formatter’s doFormat method
// with one that maps index ticks to dates. Some of those dates
// are undefined (e.g. those whose ticks fall out of defined data
// range) and we must filter out and account for those, otherwise
// the formatter computes invalid visible span and returns some
// labels as ‘ERR’.
// Note, after this assignment statement, on next plot redrawing,
// our override doFormat will be called directly
// – FunctionTickFormatter.doFormat(), i.e. this code, no longer
// executes.
axis.formatter.doFormat = function (ticks) {
const dates = ticks.map(i => source.data.date[i]),
valid = t => t !== undefined,
labels = formatter.doFormat(dates.filter(valid));
let i = 0;
return dates.map(t => valid(t) ? labels[i++] : ‘’);
};
// Before the second redrawing when above doFormat will be called,
// we are still within this current labels formatting.
// FuncTickFormatter gets passed a single tick at a time, but
// DatetimeTickFormatter requires all ticks at once to work.
// We handle that by formatting all axis’ ticks with the function
// we constructed above and then just taking out the current tick.
// Note: .tick_coords probably not public API
const ticks = axis.tick_coords.major[0],
labels = axis.formatter.doFormat(ticks);
return labels[ticks.indexOf(tick)];
“”")
return p
Plot a glyph (small vbar) in EVERY CANDLE.
It marks the price where the maximum volume is traded.
def plot_candle_vpoc(df, p):
df[‘date’] = df.index # Have real dates in ‘date’ column
df.reset_index(drop=True, inplace=True) # And a simple range(0,n) index
create a small vbar
size = 0.00001
df[“vpoc_max_top”] = df[“vpoc_max”] + size
df[“vpoc_max_bottom”] = df[“vpoc_max”] - size
source = ColumnDataSource(df)
p.vbar(‘index’, .7, ‘vpoc_max_bottom’, ‘vpoc_max_top’, source=source, line_color=‘black’,fill_color=“black”)
return p
Plot a small glyph (small vbar, but MORE GREATER THAN glyphs in previous function)
Similar to candle VPOC, but only marks ONE CANDLE EVERY DAY:
the price where the maximum volume is traded in that day.
def plot_cluster(df, p):
df[‘date’] = df.index # Have real dates in ‘date’ column
df.reset_index(drop=True, inplace=True) # And a simple range(0,n) index
create a small vbar
size = 0.00001
df[“vpoc_max_top”] = df[“vpoc_max”] + size
df[“vpoc_max_bottom”] = df[“vpoc_max”] - size
source = ColumnDataSource(df)
p.vbar(‘index’, 2, ‘vpoc_max_bottom’, ‘vpoc_max_top’, source=source, fill_color=“red”, line_color=“green”)
return p
read the CSV’s
df_ohlcv = read_csv(“df_ohlcv.csv”)
df_candle_vpoc = read_csv(“df_candle_vpoc.csv”)
df_max_cluster_volume = read_csv(“df_max_cluster_volume.csv”)
p = plot_ohlcv(df_ohlcv) # OK, no problem
p = plot_candle_vpoc(df_candle_vpoc, p) # OK, no problem, EVERY CANDLE has a VPOC
p = plot_cluster(df_max_cluster_volume, p) # PROBLEM: every day only ONE CANDLE has the maximum volume
show(p)
``
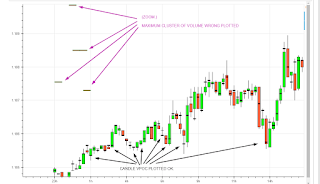
The OHLC plot is OK.
The Candle VPOC plot is OK (every candle has a small glyph, a black vbar).
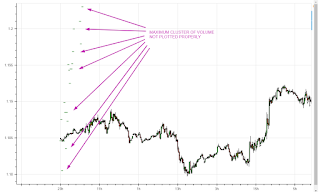
The maximum cluster of volume plot is wrong. Only one candle a day needs to be marked. The glyph is plotted in the left side of the chart
Thanks in advance.
df_candle_vpoc.csv (78.1 KB)
df_max_cluster_volume.csv (1.16 KB)
df_ohlcv.csv (141 KB)
···
El lunes, 5 de febrero de 2018, 22:22:51 (UTC+1), Kernc escribió:
Can you share a minimal (non-)working example?

