from bokeh.models import Div

kpi_glass = Div(text="""
<div style="
    backdrop-filter: blur(8px);
    background: rgba(255,255,255,0.33);
    border-radius: 2em;
    box-shadow: 0 8px 32px 0 rgba(31,38,135,0.18);
    border: 1.5px solid rgba(31,38,135,0.14);
    padding: 2em 2.1em 1.6em 2.1em;
    min-width: 220px;
    text-align: center;
    margin: 1.5em auto;
">
    <div style="font-size: 2.2em; font-weight: 900; color: #161a30; margin-bottom:0.28em;">1023</div>
    <div style="font-size: 1.02em; color: #2c365c; letter-spacing:1.2px;">Active Users</div>
</div>
""")
kpi_neon = Div(text="""
<div style="
    background: linear-gradient(120deg,#272e6a 0%,#0a1829 100%);
    border-radius: 1.4em;
    box-shadow: 0 2px 14px 0 #0005;
    padding: 2em 2em 1.6em 2em;
    min-width: 210px;
    text-align: center;
    margin: 1.2em auto;
">
    <div style="font-size:2.1em; font-weight:800; color:#18f0b8;
                text-shadow: 0 0 14px #18f0b8, 0 0 2px #18f0b8;">
        $9,150
    </div>
    <div style="font-size:1em; color:#8dc1ff; margin-top:0.15em;">
        Monthly Revenue
    </div>
    <div style="margin-top:0.4em; font-size:0.95em; color:#44e462;">
        ▲ +5.2% this month
    </div>
</div>
""")
kpi_leftbar = Div(text="""
<div style="
    display: flex;
    align-items: center;
    background: #f9fafe;
    border-left: 7px solid #845EC2;
    border-radius: 1.1em;
    box-shadow: 0 2px 10px #dad6ff33;
    padding: 1.7em 1.4em;
    min-width: 220px;
    margin: 1em auto;
">
    <div style="flex:1; text-align: left;">
        <div style="font-size: 1.4em; color: #845EC2; font-weight: 900;">
            72%
        </div>
        <div style="font-size: 1.02em; color: #262348;">
            System Health
        </div>
    </div>
    <div style="font-size: 1.4em; color: #e980fc; margin-left: 0.6em;">
        ❤
    </div>
</div>
""")
kpi_icon = Div(text="""
<div style="
    background: #fff;
    border-radius: 1.7em;
    box-shadow: 0 3px 14px #44337a13;
    padding: 2em 1.6em 1.4em 1.6em;
    min-width: 220px;
    text-align: center;
    margin: 1em auto;
">
    <div style="font-size: 2.4em; color: #0096c7; margin-bottom: 0.15em;">📈</div>
    <div style="font-size: 2.05em; color: #003459; font-weight:800;">
        438
    </div>
    <div style="font-size: 1.06em; color: #2b3a67; margin-top:0.13em;">
        Sales Today
    </div>
    <div style="margin-top: 0.29em; font-size: 0.98em; color: #38b000;">
        ▲ +16% vs yesterday
    </div>
</div>
""")

kpi_animated_icon = Div(text="""
<style>
@keyframes upWiggle {
  0% { transform: translateY(0) scale(1);}
  25% { transform: translateY(-5px) scale(1.18);}
  50% { transform: translateY(-2px) scale(1);}
  75% { transform: translateY(-7px) scale(1.1);}
  100% { transform: translateY(0) scale(1);}
}
.kpi-arrow {
  display:inline-block;
  color: #33c463;
  font-size: 1.3em;
  font-weight: bold;
  margin-left:0.4em;
  animation: upWiggle 1.4s infinite;
}
</style>
<div style="
    background: linear-gradient(120deg,#fafcfc 0%,#e8f7ee 100%);
    border-radius: 1.5em;
    box-shadow: 0 6px 22px #33c46311;
    padding: 2.2em 2.2em 1.7em 2.2em;
    min-width: 210px;
    text-align: center;
    margin: 1.2em auto;
">
    <div style="font-size:2.7em; font-weight:900; color:#1f6136;">
        41,230 <span class="kpi-arrow">▲</span>
    </div>
    <div style="font-size:1em; color:#417153; margin-top:0.23em;">
        Page Views
    </div>
    <div style="margin-top:0.41em; font-size:1.02em; color:#33c463;">
        +7.1% this week
    </div>
</div>
""")

kpi_animated_bg = Div(text="""
<style>
@keyframes gradientMove {
  0% {background-position: 0% 50%;}
  50% {background-position: 100% 50%;}
  100% {background-position: 0% 50%;}
}
.kpi-animated-bg {
  background: linear-gradient(270deg, #d9afd9, #97d9e1, #c3cfe2, #f6d365);
  background-size: 800% 800%;
  animation: gradientMove 4s ease-in-out infinite;
}
</style>
<div class="kpi-animated-bg" style="
    border-radius: 1.4em;
    box-shadow: 0 4px 16px #44337a18;
    padding: 2.3em 2em 1.7em 2em;
    min-width: 210px;
    text-align: center;
    margin: 1.2em auto;
">
    <div style="font-size:2.2em; font-weight:800; color:#233053;">5,620</div>
    <div style="font-size:1em; color:#41346b; margin-top:0.14em;">
        App Downloads
    </div>
    <div style="font-size:0.97em; color:#28648a; margin-top:0.37em;">
        ▲ +12% this month
    </div>
</div>
""")
from bokeh.layouts import row, column
from bokeh.plotting import show

show(column(row(kpi_glass, kpi_neon, kpi_leftbar),
           row(kpi_icon,kpi_animated_icon,kpi_animated_bg)))
from bokeh.models import Div
from bokeh.plotting import figure, show
import numpy as np
import tempfile
import os
from bokeh.io import export_svg
# Generate sparkline data
spark = np.cumsum(np.random.randn(30)) + 20
# Make sparkline plot
f = figure(width=120, height=34, toolbar_location=None, min_border=0, outline_line_color=None)
f.line(np.arange(len(spark)), spark, line_width=2, color="#00b3ff")
f.background_fill_color = None
f.xaxis.visible = False
f.yaxis.visible = False
f.grid.visible = False
# Export as SVG to a temp file, then read SVG code
with tempfile.NamedTemporaryFile(suffix='.svg', delete=False) as tmp_svg:
export_svg(f, filename=tmp_svg.name)
tmp_svg.seek(0)
svg_data = tmp_svg.read().decode()
os.remove(tmp_svg.name) # Clean up the temp file
# Build the KPI card with embedded SVG sparkline
kpi_sparkline = Div(text=f"""
<div style="
background: #fff;
border-radius: 1.5em;
box-shadow: 0 6px 18px #0096c744;
padding: 2.1em 1.8em 1.7em 1.8em;
min-width: 210px;
text-align: center;
margin: 1.2em auto;
">
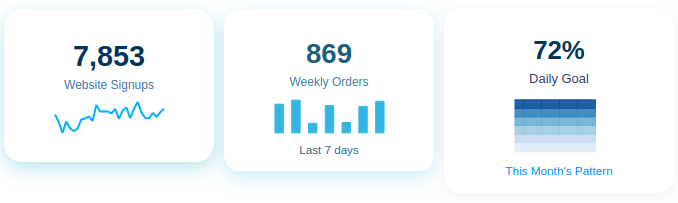
<div style="font-size:2.4em; font-weight:800; color:#003459;">7,853</div>
<div style="font-size:1em; color:#3975a6; margin-bottom:0.5em;">
Website Signups
</div>
<div style="margin:0 auto 0.2em auto; display:inline-block;">
{svg_data}
</div>
</div>
""")
# Simulate some mini bar data (7 days)
bars = np.random.randint(20, 90, 7)
days = ['Mon','Tue','Wed','Thu','Fri','Sat','Sun']
f = figure(width=120, height=36, toolbar_location=None, min_border=0, outline_line_color=None)
f.vbar(x=np.arange(7), top=bars, width=0.5, color="#34b6e4")
f.background_fill_color = None
f.xaxis.visible = False
f.yaxis.visible = False
f.grid.visible = False
with tempfile.NamedTemporaryFile(suffix='.svg', delete=False) as tmp_svg:
export_svg(f, filename=tmp_svg.name)
tmp_svg.seek(0)
svg_data = tmp_svg.read().decode()
os.remove(tmp_svg.name)
kpi_bar = Div(text=f"""
<div style="
background: #fff;
border-radius: 1.3em;
box-shadow: 0 6px 18px #34b6e444;
padding: 2em 1.6em 1.1em 1.6em;
min-width: 210px;
text-align: center;
margin: 1.2em auto;
">
<div style="font-size:2.3em; font-weight:800; color:#195e7a;">869</div>
<div style="font-size:1em; color:#3e7fa3;">
Weekly Orders
</div>
<div style="margin:0.6em auto 0.2em auto; display:inline-block;">
{svg_data}
</div>
<div style="font-size:0.97em; color:#28648a;">
Last 7 days
</div>
</div>
""")
# Example: random calendar heatmap (7 days x 5 weeks)
data = np.random.randint(0, 25, (7, 5))
f = figure(width=90, height=60, toolbar_location=None, min_border=0, outline_line_color=None,
x_range=(0,5), y_range=(0,7))
f.rect(x=np.repeat(np.arange(5),7), y=np.tile(np.arange(7),5), width=1, height=1,
color=["#f7fbff","#deebf7","#c6dbef","#9ecae1","#6baed6","#3182bd","#08519c"] * 5,
alpha=0.9)
f.background_fill_color = None
f.axis.visible = False
f.grid.visible = False
with tempfile.NamedTemporaryFile(suffix='.svg', delete=False) as tmp_svg:
export_svg(f, filename=tmp_svg.name)
tmp_svg.seek(0)
svg_data = tmp_svg.read().decode()
os.remove(tmp_svg.name)
kpi_heatmap = Div(text=f"""
<div style="
background: #fff;
border-radius: 1.4em;
box-shadow: 0 3px 14px #44337a13;
padding: 2em 1.4em 1.1em 1.4em;
min-width: 230px;
text-align: center;
margin: 1em auto;
">
<div style="font-size:2.15em; color:#003459; font-weight:800;">
72%
</div>
<div style="font-size:1.08em; color:#2b3a67; margin-top:0.1em;">
Daily Goal
</div>
<div style="margin:0.55em auto 0.2em auto; display:inline-block;">
{svg_data}
</div>
<div style="font-size:0.98em; color:#038aff;">
This Month's Pattern
</div>
</div>
""")
show(row(kpi_sparkline,kpi_bar,kpi_heatmap))
from bokeh.models import Div
from bokeh.plotting import show

progress = 83  # percent

kpi_progress_hover = Div(text=f"""
<style>
.kpi-card-hover {{
  transition: transform 0.22s cubic-bezier(.4,1.4,.5,1), box-shadow 0.22s;
  box-shadow: 0 3px 14px #44337a13;
}}
.kpi-card-hover:hover {{
  transform: translateY(-13px) scale(1.032) rotateZ(-0.5deg);
  box-shadow: 0 14px 40px #38b00044, 0 1px 6px #a2e8dd11;
  z-index: 3;
}}
</style>
<div class="kpi-card-hover" style="
    background: #fff;
    border-radius: 1.4em;
    padding: 2em 1.4em 1.25em 1.4em;
    min-width: 230px;
    text-align: center;
    margin: 1em auto;
    cursor: pointer;
">
    <div style="font-size:2.15em; color:#009688; font-weight:800;">
        {progress}%
    </div>
    <div style="font-size:1.08em; color:#49757e; margin-top:0.1em;">
        Project Completion
    </div>
    <div style="margin-top:1.1em; margin-bottom:0.5em;">
        <div style="height:14px; width:85%; margin:0 auto; background:#e0f2f1; border-radius:9px; overflow:hidden;">
            <div style="
                height:100%; width:{progress}%; background:linear-gradient(90deg, #5ee7df 0%, #b490ca 100%);
                border-radius:9px 0 0 9px; transition: width 1s;">
            </div>
        </div>
    </div>
    <div style="font-size:0.98em; color:#009688;">
        Keep it up!
    </div>
</div>
""")
show(kpi_progress_hover)
from bokeh.plotting import figure, show
from bokeh.models import Div, Column
import numpy as np
# KPI values
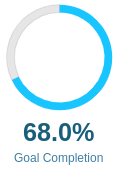
percent = 0.68 # 68%
main_value = str(percent*100)+"%"
label = "Goal Completion"
# Draw arc for radial progress
p = figure(width=120, height=120, x_range=(-1,1), y_range=(-1,1),
toolbar_location=None, outline_line_color=None, min_border=0, tools='')
p.annular_wedge(
0, 0, 0.88, 0.75,
start_angle=np.pi/2, end_angle=np.pi/2 - 2*np.pi*percent, direction="anticlock",
color="grey", alpha=0.2, line_color="grey"
)
p.annular_wedge(
0, 0, 0.88, 0.75,
start_angle=np.pi/2 - 2*np.pi*percent, end_angle=np.pi/2 - 2*np.pi*1.0, direction="anticlock",
color="deepskyblue", alpha=0.9, line_color=None
)
p.axis.visible = False
p.xgrid.visible = False
p.ygrid.visible = False
# Overlay the main value using a Bokeh Div
kpi_radial = Div(text=f"""<br><br><br><br><br>
<div style="text-align:center; margin-top:-94px;margin-left:10px; margin-bottom:10px;">
<div style="font-size:2.1em; font-weight:900; color:#195e7a;">{main_value}</div>
<div style="font-size:1em; color:#3e7fa3;">{label}</div>
</div>
""")
show(Column(p, kpi_radial))