I’m wondering what would be the correct way to assign data that is divided/multiplied by constant or summed up or averaged (examples: np.sum(data) , np.cumsum(data/np.sum(data)) to y not using ColumnDataSource. Apperciate any suggestion.
This is mainly because data is already defined in CDS: ‘y_data’: data
So the rest is just simply math operations utilizing this variable. I was thinking about sth like this:
There are some built-in facilities for that: bokeh.transform — Bokeh 2.4.2 Documentation
As you can see, cumsum already exists there. If you find something missing, it’s usually pretty simple to implement using CustomJSTransform.
Can you please list all built-in math functions (or sent a link)? Cumcum is only one o such funcs. Same to CustomJSTransform. I’d like to read more about it.
CustomJSTransform is challenging for me. Can you please give us, as the reference point, the piece of code how to compute division by scalar (say, 5), as an example?
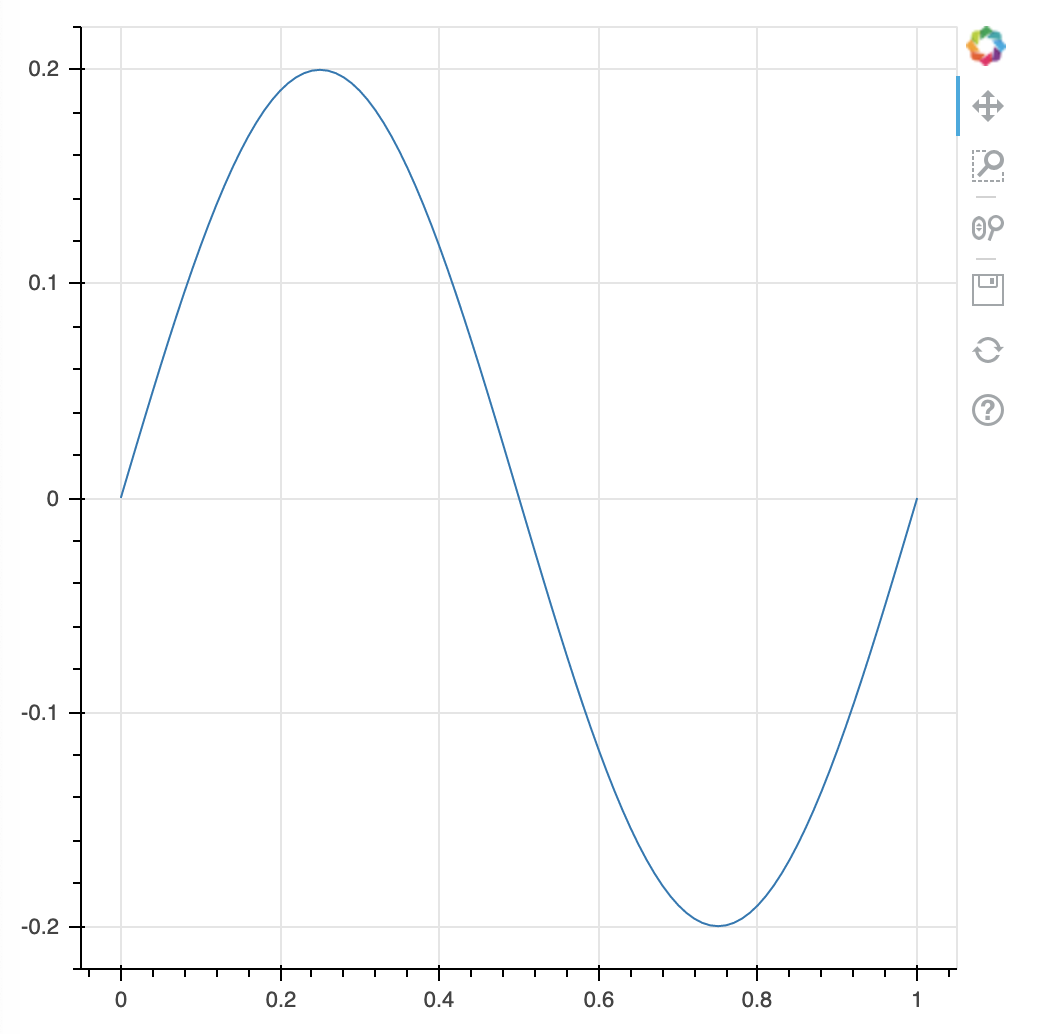
Here’s a basic example where the y data are a sine wave, and the plotted signal is this signal with 1/5 amplitude by using the CustomJSTransform.
The vectorized function argument v_func means that the transform is applied to a vector of values (in this case a sampled sine-wave) and returns a signal of equal length transformed through that function v_func.
#!/usr/bin/env python3
# -*- coding: utf-8 -*-
"""
"""
import numpy as np

from bokeh.plotting import figure, show

from bokeh.transform import transform
from bokeh.models.transforms import CustomJSTransform

v_func = '''
    var rv = new Float64Array(xs.length)
    for(let i = 0; i < xs.length; i++) {
        rv[i] = xs[i] / 5.0
    }
    return rv
'''

x = np.linspace(0.0,1.0,101)
y = np.sin(2.0*np.pi*x)

data = dict(x=x, y=y)

p = figure(width=500, height=500)
ry = p.line(x='x',y=transform('y', CustomJSTransform(v_func=v_func)), source=ColumnDataSource(data=data))

show(p)