Span on datetime x-axis is not displayed where expected

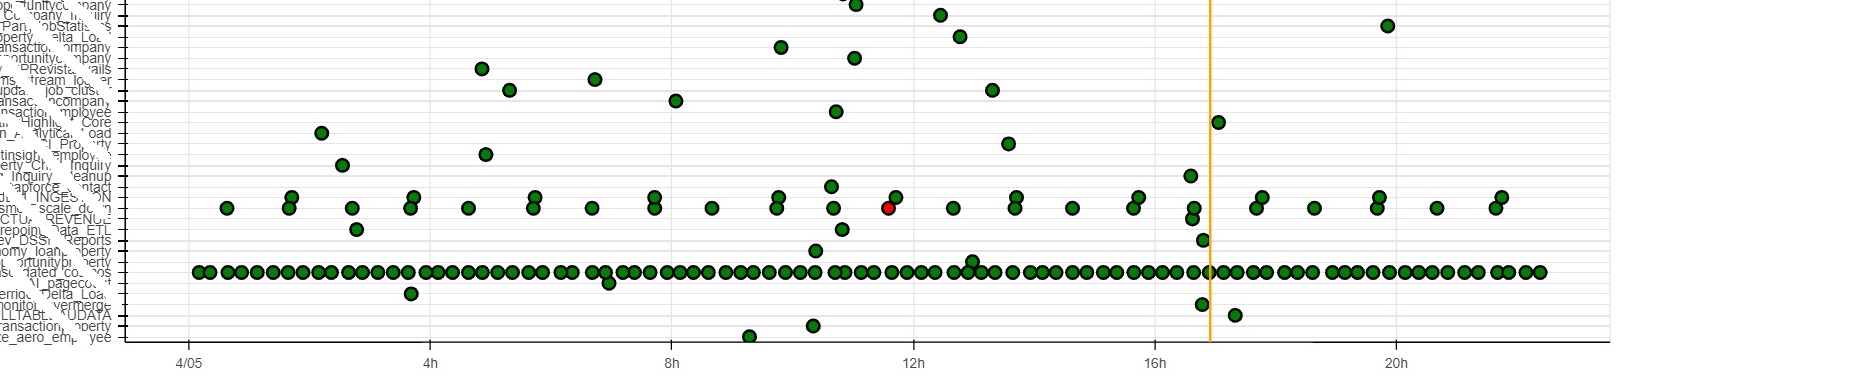
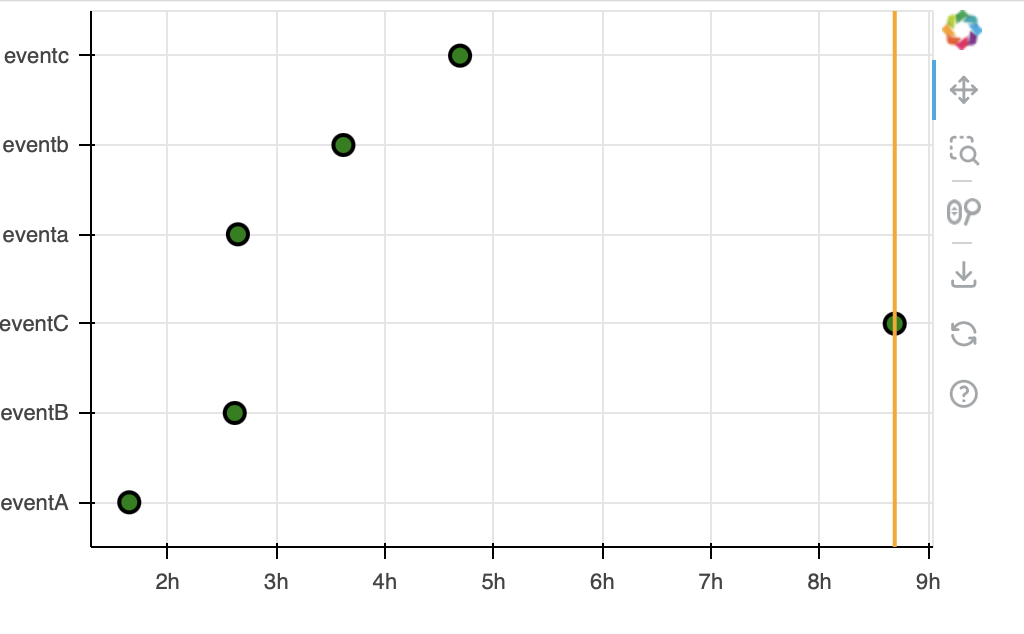
I am new to Python and Bokeh. I have a pandas dataframe which contains Events. I am using Bokeh charts to Visualize events. EventTime is displayed on the x-axis and EventName is projected on the y-axis. The visualization is rendered as expected. I am then trying to add a Span(annotation) on the x-axis(with height dimension) to show when the last event occurred(Max of EventTime). The Span is not displayed where it is expected. Please advise.

Thank you for trying :slight_smile:

Code Snippet:

source = ColumnDataSource(data=dict(
    x = events_to_analyse.EventTime,
    y = events_to_analyse.EventName
))

span_last_udapted = time.mktime(datetime(d_last_updated.year, d_last_updated.month, d_last_updated.day, d_last_updated.hour, d_last_updated.minute, 0).timetuple())*1000
v_span_last_udapted = Span(location=span_last_udapted, dimension='height', line_color='orange', line_width=2)

p = figure(x_axis_type='datetime', y_range=list(set(source.data['y'])), plot_width=1500, plot_height=7000)
p.circle('x', 'y', size=10, line_color='w', fill_color='z', line_width=2, source=source)
p.add_layout(v_span_last_udapted)

show(p)

Note: here d_last_updated = max(EventTime)

Hi @cklemy in order to help we need to actually run code and investigate. Please provide a complete Minimal Reproducible Example as well as relevant version information.

Thank you Bryan for your time.

Here is a minimal Reproducible Example:


import pandas as pd
from datetime import datetime
from dateutil.parser import parse    
from bokeh.plotting import figure, show, output_notebook
from bokeh.models import Span, ColumnDataSource
import time

data = [['eventA', '2023-04-06 01:38:40'], ['eventB', '2023-04-06 02:36:55'], ['eventC', '2023-04-06 08:41:20'],
       ['eventa', '2023-04-06 02:38:40'], ['eventb', '2023-04-06 03:36:55'], ['eventc', '2023-04-06 04:41:20']]
  
# Create the pandas DataFrame
df_events = pd.DataFrame(data, columns=['EventName', 'EventTime'])
df_events['EventTime'] = pd.to_datetime(df_events.EventTime)

source = ColumnDataSource(data=dict(
    x = df_events.EventTime,
    y = df_events.EventName
))

p = figure(x_axis_type='datetime', y_range=list(set(source.data['y'])), plot_width=500, plot_height=300)
p.circle('x', 'y', size=10, line_color='black', fill_color='green', line_width=2, source=source)

d_last_updated = df_events.EventTime.max()
span_last_udapted = time\
.mktime(datetime(d_last_updated.year, d_last_updated.month, d_last_updated.day, d_last_updated.hour, d_last_updated.minute, 0)\
        .timetuple())*1000
v_span_last_udapted = Span(location=span_last_udapted, dimension='height', line_color='orange', line_width=2)
p.add_layout(v_span_last_udapted)

show(p)

I am expecting the Span to be aligned with β€˜eventC’ or β€˜2023-04-06 08:41:20’ which is towards the far right end of the figure.

Bokeh Version/Build:
bokeh 2.3.2 py38haa95532_0

With Bokeh 3.1 and appropriatately updated / simplified code:

p = figure(width=500, height=300,
           x_axis_type='datetime', y_range=source.data['y'].unique())

p.circle('x', 'y', size=10, source=source
         line_color='black', fill_color='green', line_width=2)

v_span_last_udapted = Span(location=df_events.EventTime.max(),
                           dimension='height',
                           line_color='orange',
                           line_width=2)

p.add_layout(v_span_last_udapted)

the expected result is obtained:

So this was fixed at some point since the (fairly old) Bokeh version 2.3.2. It is always advised to check out a suspected bug/problem with the latest version to see if this is the case. The solution is to upgrade your Bokeh version (there will be no more 2.x releases).

Thank you Bryan.
have a wonderful day!! :slight_smile:

This topic was automatically closed 90 days after the last reply. New replies are no longer allowed.