I would like to use the Spinner Widget (instead of TextInput) to enter numerical values. Anybody, who can share an example of how to do this? Or anybody, who knows where I can find examples of how to do this?
from bokeh.plotting import figure, show
from bokeh.models import CustomJS, TextInput, Paragraph, ColumnDataSource
from bokeh.layouts import widgetbox, column
"""Plot depending on User Input."""
x = [xi * 0.001 for xi in range(0, 1000)]
a = 1
y = [a*xi for xi in x]
source = ColumnDataSource(
data=dict(x=x, y=y)
)
plot = figure(
plot_width=400, plot_height=400,
x_axis_label="x",y_axis_label="y",
toolbar_location=None,
active_drag=None,
background_fill_color=None,
border_fill_color=None
)
plot.line('x', 'y', source=source, line_width=3, line_alpha=0.6)
callback = CustomJS(args=dict(source=source), code="""
var data = source.data;
var input = cb_obj.value;
a = input
var x = data['x'];
var y = data['y'];
for (var i = 0; i < x.length; i++) {
y[i] = a*x[i];
}
source.change.emit();
""")
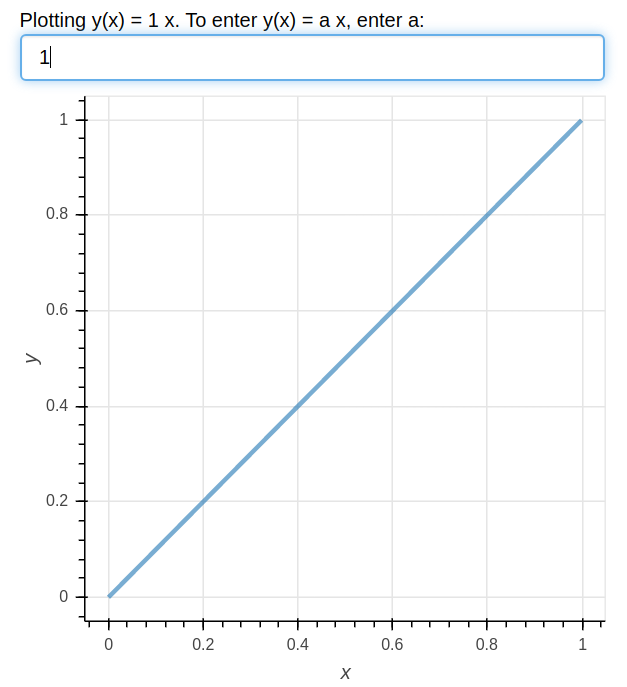
text_input = TextInput(value="", title="Plotting y(x) = 1 x. To enter y(x) = a x, enter a:", callback=callback)
layout = column(text_input, plot)
show(layout)
Hi Kai Kaßbohm! Thanks for the great working example!
I searched the “examples” subdir in the bokeh repo and found an instance of Spinner here:
https://github.com/bokeh/bokeh/blob/master/examples/models/file/widgets.py
It’s pretty simple, and I tried it out in your code. I did notice that as the line slope changes, the plot adjusts its axes; I’m assuming you DON’T want that, so I added some explicit definitions of the x_range and y_range.
from bokeh.plotting import figure, show
from bokeh.models import CustomJS, TextInput, Paragraph, ColumnDataSource, Range1d
from bokeh.layouts import widgetbox, column
from bokeh.models.widgets import Spinner

"""Plot depending on User Input."""

x = [xi * 0.001 for xi in range(0, 1000)]
a = 1
y = [a*xi for xi in x]

source = ColumnDataSource(data=dict(x=x, y=y))

plot = figure(
            plot_width=400, plot_height=400,
            x_axis_label="x",y_axis_label="y",
            toolbar_location=None,
            active_drag=None,
            background_fill_color=None,
            border_fill_color=None
)
plot.x_range = Range1d(start=0, end=1)
plot.y_range = Range1d(start=0, end=1)

plot.line('x', 'y', source=source, line_width=3, line_alpha=0.6)

callback = CustomJS(args=dict(source=source), code="""
            var data = source.data;
            var input = cb_obj.value;

            a = input

            var x = data['x'];
            var y = data['y'];

            for (var i = 0; i < x.length; i++) {
            y[i] = a*x[i];
            }

            source.change.emit();
            """)
# text_input = TextInput(value="", title="Plotting y(x) = 1 x. To enter y(x) = a x, enter a:", callback=callback)
spinner = Spinner(value=1, title="Plotting y(x) = 1 x. To enter y(x) = a x, enter a:", callback=callback)

layout = column(spinner, plot)
show(layout)
1 Like