Trying to get squarify w/ Bokeh working in Jupyter notebook. I’m guessing something deeper in bokeh w/ the canvas engine, but hoping for something obvious I’m missing.
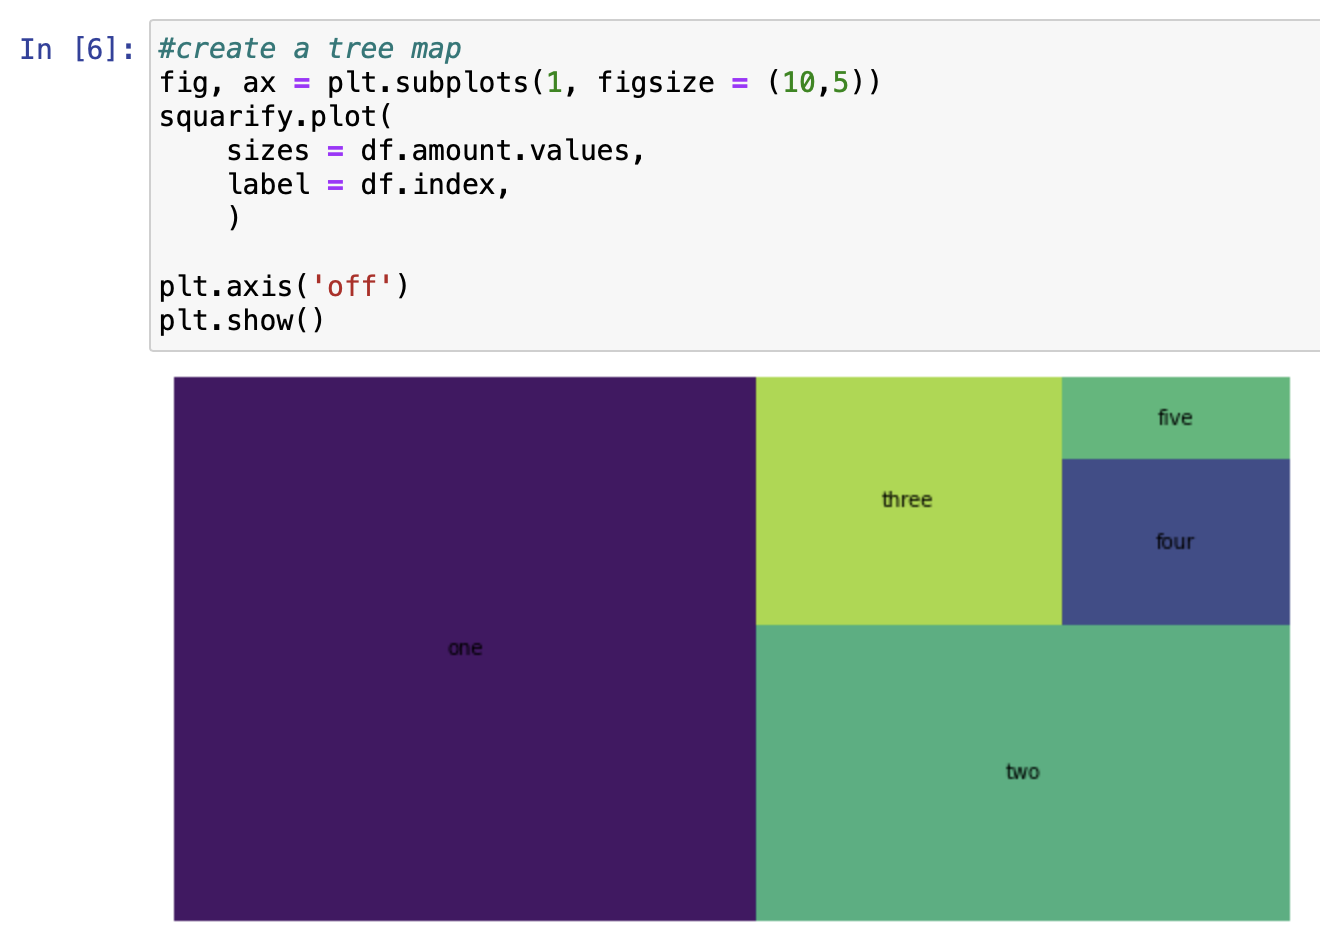
w/ squarify plot helper and matplotlib
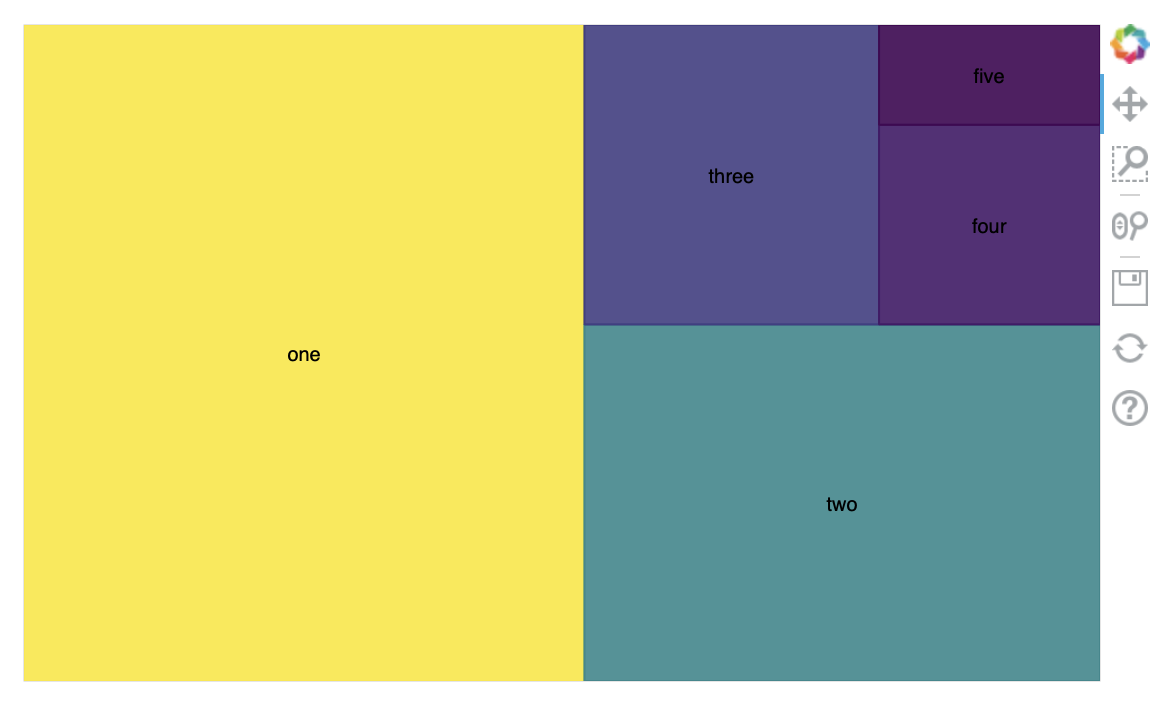
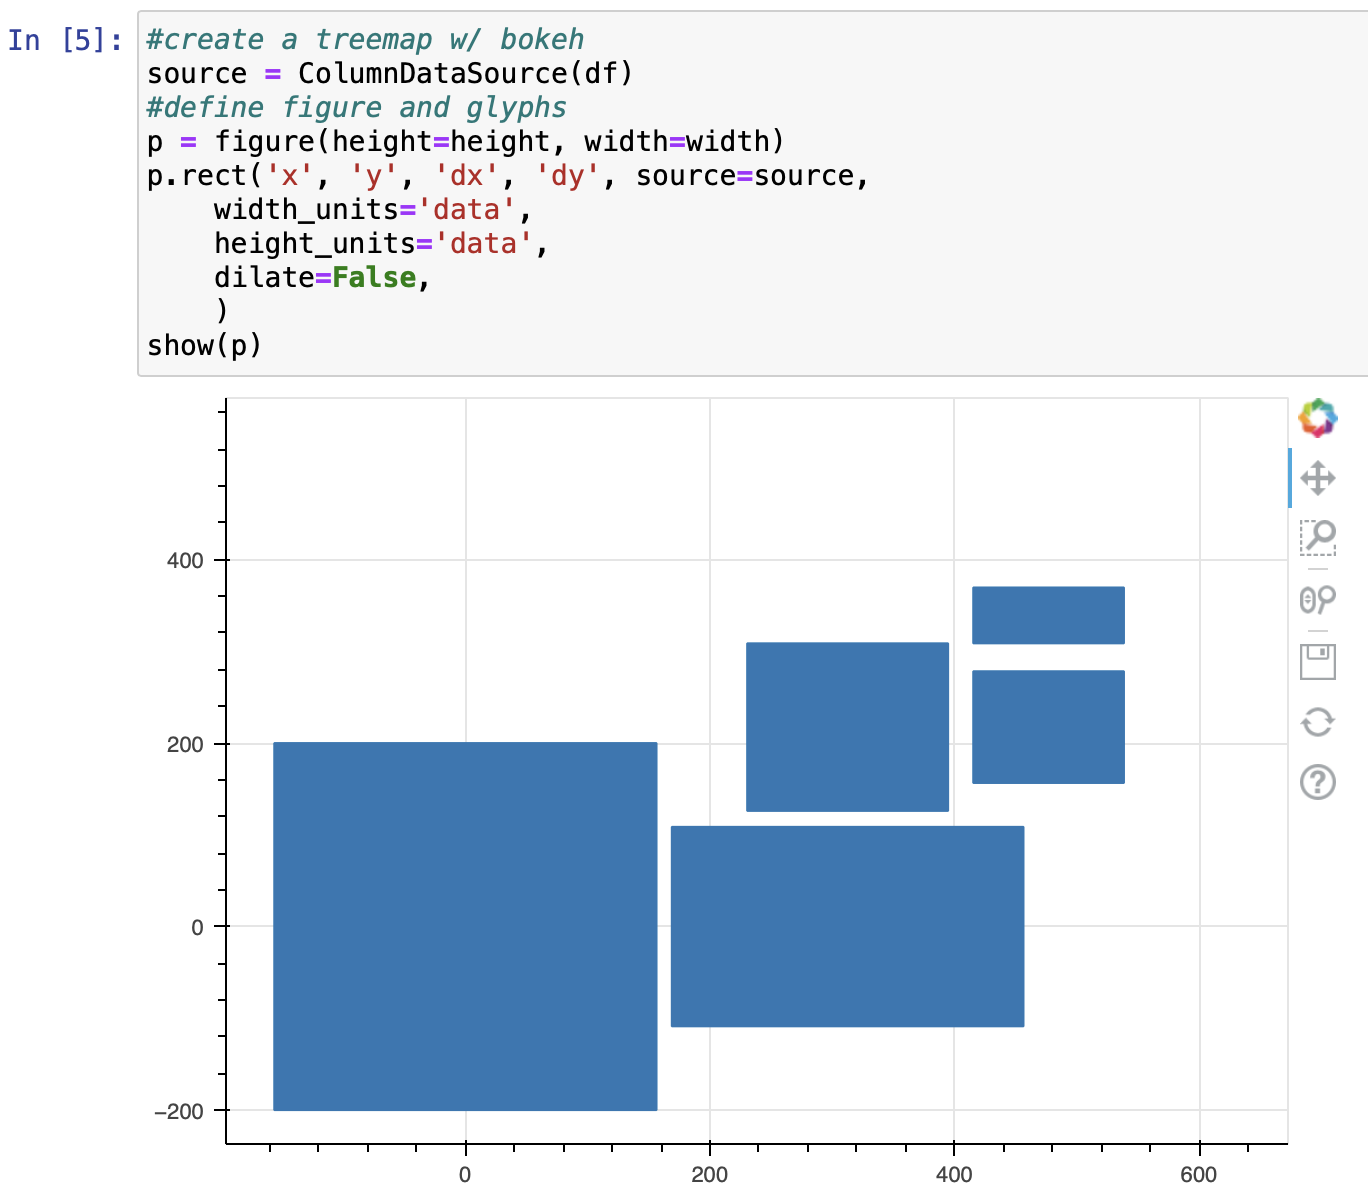
w/ squarify and bokeh
squarify repo | GitHub - laserson/squarify: Pure Python implementation of the squarify treemap layout algorithm
Jupyter Minimal Example
import pandas as pd
import squarify
import matplotlib.pyplot as plt
from bokeh.models import ColumnDataSource
from bokeh.plotting import figure
from bokeh.io import show, output_notebook
output_notebook()

#dict init
df = dict(
    one=[50],
    two= [25],
    three = [12],
    four = [6],
    five = [3],
    )

#df init
df = pd.DataFrame.from_dict(
    data=df,
    orient='index',
    columns=[
        'amount',
    ])
df.index.name = 'labels'

#create a tree map
fig, ax = plt.subplots(1, figsize = (10,5))
squarify.plot(
    sizes = df.amount.values,
    label = df.index,
    )
plt.axis('off')
plt.show()

#squarify
x,y = 0,0
height = 400
width = 600

df.sort_values(by='amount', inplace=True, ascending=False)
df['rect_norm'] = squarify.normalize_sizes(df.amount, width, height)
rect_df = pd.DataFrame.from_dict(
    data=squarify.squarify(df.rect_norm, x, y, width, height)
    )
rect_df.set_index(df.index, inplace=True)
#combine back
df = df.join(rect_df, how='left')

#create a treemap w/ bokeh
source = ColumnDataSource(df)
#define figure and glyphs
p = figure(height=height, width=width)
p.rect('x', 'y', 'dx', 'dy', source=source,
    width_units='data',
    height_units='data',
    dilate=False,
    )
show(p)