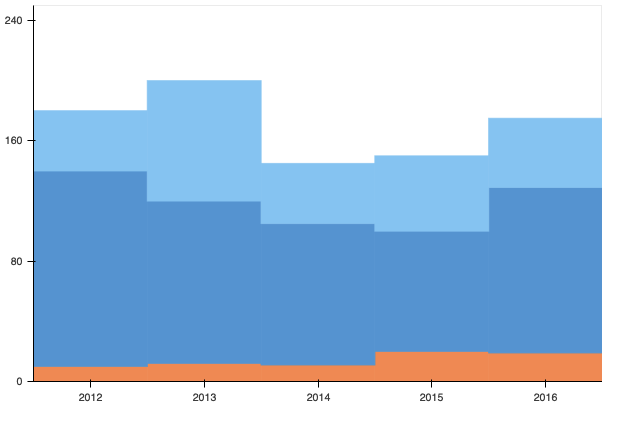
Hi, I am trying to create a stacked area plot with step levels to produce a plot something like the figure below. Is this possible?

Hi rjz,
The easiest way to do this is probably with a vbar_stack. Here’s an example, approximating your example:
from bokeh.plotting import figure, show
from bokeh.models import ColumnDataSource

x = [2012, 2013, 2014, 2015, 2016]
y1 = [10, 12, 11, 20, 19]
y2 = [130, 108, 94, 80, 110]
y3 = [40, 80, 40, 50, 46]
light_blue = '#90c9f5'
med_blue = '#5f9cd9'
orange = '#f29456'

source = ColumnDataSource(dict(x=x, y1=y1, y2=y2, y3=y3))

p = figure(title=None, plot_width=600, plot_height=400, min_border=0, toolbar_location=None, x_range=(2011.5, 2016.5), y_range=(0, 250))
p.vbar_stack(['y1', 'y2', 'y3'], x='x', width=1, color=[orange, med_blue, light_blue], source=source)

p.grid.grid_line_color = None
p.xaxis.ticker = x
p.yaxis.ticker = [0, 80, 160, 240]
p.axis.minor_tick_line_color = None

show(p)
1 Like
Hi carolyn, thanks for the solution, it is almost perfect. However I have run into a performance issue when applied to my use case. I have created an interactive dashboard which plots a large amount of timeseries data, approximately 10 years of half-hourly sampled data. The varea_stack method performs very well when zooming and panning the plot but interpolates between data points, while the vbar_stack method renders the data how I’d like but zooming and panning is very slow. Is there a way to get the best of both worlds? A working example is shown below
from bokeh.plotting import figure, show
import pandas as pd
import numpy as np

n = 10
df = (
    pd.DataFrame(
        index=pd.date_range(start='2020-1-1', freq='AS', periods=n),
        data=np.arange(n)[::-1],
        columns=['A'],
    )
    .resample('30T')
    .pad()
    .iloc[:-1]
    .assign(B=lambda x: 1 * ((x.index.hour >= 7) & (x.index.hour < 22)))
)

kwargs = dict(
    stackers=['A', 'B'],
    x='index',
    color=['blue', 'green'],
    source=df,
)

# Slow
p1 = figure(output_backend="webgl", x_axis_type="datetime")
p1.vbar_stack(
    width=30*60*1E3,  # Width in milliseconds
    **kwargs
)
show(p1)

# Fast
p2 = figure(output_backend="webgl", x_axis_type="datetime")
p2.varea_stack(**kwargs)
show(p2)@rjz I am afraid a stacked (or filled) Step glyph does not exist at present. It’s possible that there may be a way to get vline_stack and varea_stack to work with “vertical” segments, but you would need to add those extra points manually in to the data before it is plotted. I’m also not certain that it would work, it’s just something you could try.
All that said, I think the underlying issue is simple the size of your data being so large. 10 years of data at that resolution is 10*365*24*2*2 ~ 350k (x,y) points for each line, that all has to be sent to the browser. That’s getting to be out of scope for where Bokeh performs well.